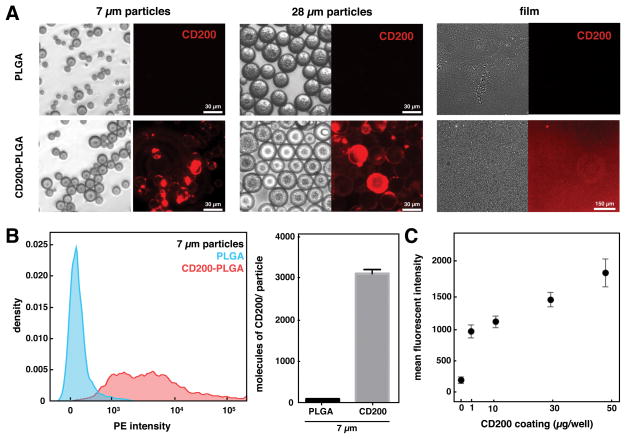
Figure 2.
modification of plga microparticles and surfaces with cd200. (a) representative bright field (left) and fluorescent (right) images of different sized unmodified plga or cd200-plga microparticles and films. (b) representative flow cytometry histogram of unmodified plga and cd200-plga 7 μm microparticles (left) and quantification of cd200 (right). data represents mean ± sem of 10,000 particles. (c) mean fluorescence intensity of cd200 bound on plga films with different coating concentration.

