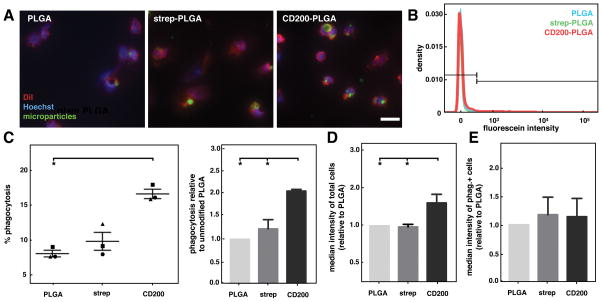
Figure 6.
phagocytosis of cd200-coated plga microparticles by human monocytes. (a) representative fluorescence images of human monocytes incubated with unmodified, streptavidin-, and cd200-plga microparticles (green), stained with dii (red), and hoechst (blue). scale bar is 20 μm. (b) representative flow cytometry histogram showing fluorescein intensity of human monocytes incubated with different plga microparticles. (c) graph of % phagocytosis of particles by human monocytes. (left). each distinct symbol (●,■,▲) represents a separate biological replicate (independent experiment, each performed in duplicate). graph of monocyte phagocytosis of different particles, relative to unmodified plga condition (right). (d) graph of median fluorescein intensity of human monocytes treated with different particles, relative to unmodified plga. (e) graph of median fluorescein intensity of phagocytosis+ human monocytes treated with different particle conditions, relative to unmodified plga. data represents mean ± sem. n=3. *p<0.05.

