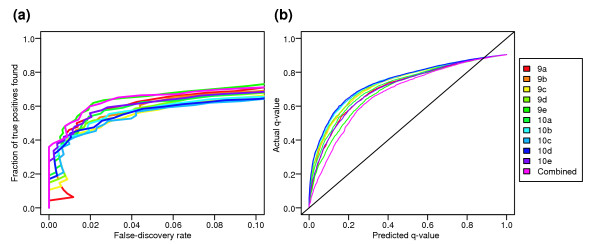
Figure 8.

The accuracy of false discovery rate estimates (q-values). The top 10 expression summary datasets (named 9a-9e, 10a-10e in Additional data file 2) were combined to generate a composite statistic, which was used to rank genes based on the robustness of their significance over the 10 datasets. (a) The composite statistic performs as well as the best summary dataset in terms of sensitivity and specificity. (b) In addition, permutation tests carried out using this composite statistic yield q-value estimates which are more accurate than any of the 10 component datasets, although still lower than the true false-discovery rate.
