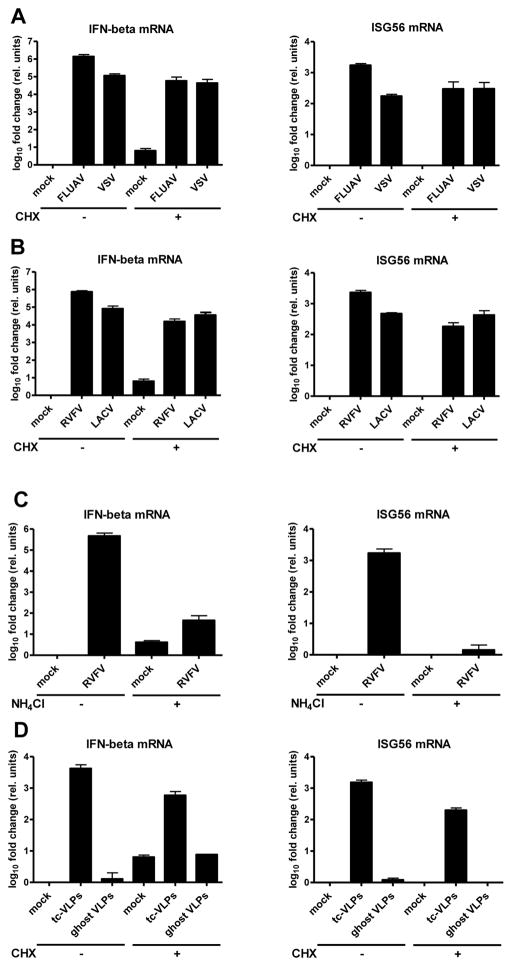
Fig. 1. IFN response to incoming negative-strand RNA viruses.
Cells were treated with inhibitors, infected, incubated for 24 h, and then assayed for mRNA levels of IFN-β (left panels) and ISG56 (right panels) using real-time RT-PCR. Here and in all following figures, mean values and standard deviations from three independent experiments are shown. (A and B) IFN response in the absence of viral genome replication. Cells were treated for 1 h with 0 or 50 μg/ml CHX, and then infected either with FLUAVΔNS1 (FLUAV) and VSV (A), or with RVFVΔNSs::GFP (RVFV) and LACVdelNSs (LACV) (B). (C and D) Requirement for virus entry. (C) Cells were treated for 1 h with 0 or 50 mM NH4Cl, and then infected with RVFVΔNSs::GFP. (D) Infection with different types of VLPs. Cells were CHX treated and infected with tc-VLPs or the equivalent amount of ghost VLPs. See also Figs. S1 to S7.

