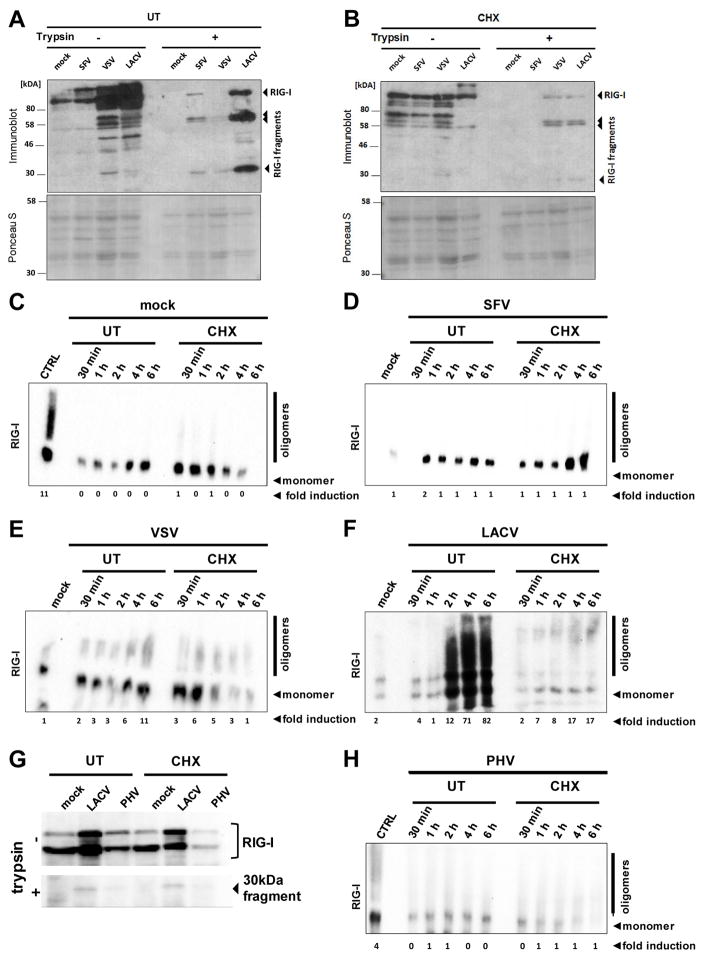
Fig. 3. Activation of RIG-I.
(A and B) Conformational switch. A549 cells were treated with 0 (A) or 50 μg/ml CHX (B), infected with the indicated viruses, and lysed 6 h later. Cell extracts were subjected to limited trypsin digestion (right panels), or left untreated (left panels). Upper panels show Western Blot analysis with an anti-RIG-I antibody, lower panels show Ponceau S staining as loading control. (C to F) Oligomerization. A549 cells were left untreated (UT) or treated with 50 μg/ml CHX. Then, cells were either mock infected (C) or infected with SFV (D), VSV (E), or LACVdelNSs (F). At the indicated time points, RIG-I was analyzed by native PAGE and Western blotting. As positive and negative controls, VSV-infected cells at 6 h post-infection (CTRL) and mock infected cells, respectively, were used. (G and H) PHV and RIG-I. A549 cells infected with LACVdelNSs or PHV were monitored for the RIG-I conformation at 6 h p.i. (G), or for RIG-I oligomerization over a time course (H). The ratio of oligomers to monomers (normalised to the actin signal and in relation to mock cells) is indicated below the blots (fold induction).

