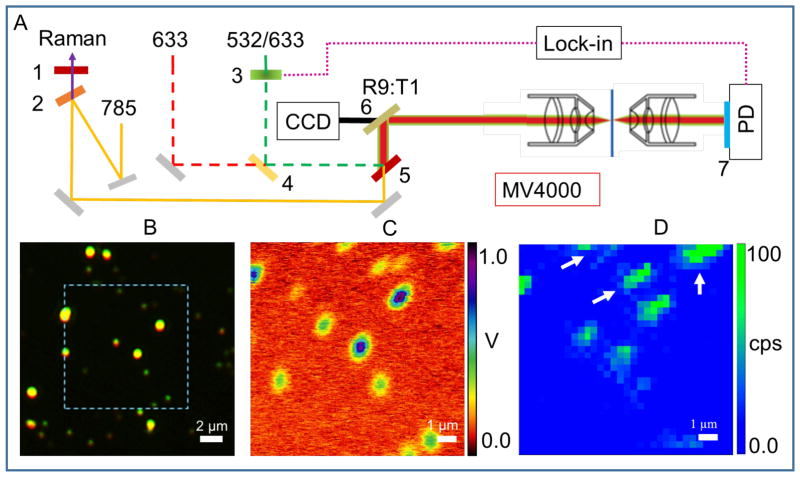
Figure 1.
Principle of PHI + SERS microscopy. (A) Instrument setup. The illustration shows photothermal microscopy in transmission geometry employing lock-in detection and equipped with a reflection mode dark field objective. The sample is translated with a piezo stage (MV4000, Nanonics Imaging LTD). 1, 633 nm long pass edge filter. 2, 785 nm short pass edge filter. 3, chopper. 4–5, dichroic laser beam combiner. 6, beam splitter. 7, band pass filter. PD, photodiode. (B) True color dark field image is shown for 80 nm gold dispersion on ITO substrate immersed in glycerol solution using a dark field objective with NA = 0.5. (C) The measured photothermal signal is plotted for the highlighted region in (B). The experimental parameters used are: heating beam intensity at 532 nm = 0.3 mW; probe beam intensity at 633 nm = 0.6 mW, time constant of lock-in is 30 ms, chopper modulation frequency = 10 KHz. (D) The SERS signal measured over the same region is shown. The experimental parameters for the SERS measurement are: Raman collection time = 1 s per pixel, 32×32 pixels. The SERS intensity is derived from the 2216 cm−1 Raman band of 4-Cyanothiophenol molecules adsorbed onto the aggregates.

