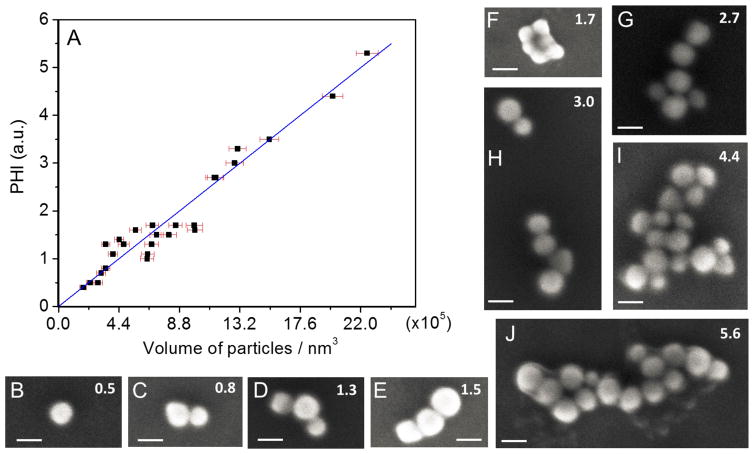
Figure 4.
(A) The photothermal signal measured from aggregates comprised of different numbers of nanoparticles is shown. The number of particles changes from 1 to 16. (B–J) Typical SEM images are shown for the nanoparticles in (A). The scale bar in all images is 80 nm. The corresponding value of the photothermal signal for each aggregate is reported in the upper right corner of each SEM image.

