Figure 2.
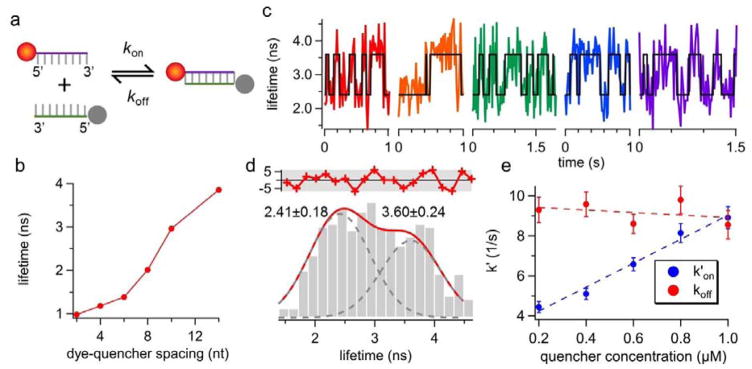
(a) The reaction scheme of the donor-quencher system. The reporter strand is a 5′-ATTO633-labeled 8-nt ssDNA. The quencher strand is a 5′-Iowa Black® FQ-labeled ssDNA that is complementary to the reporter. (b) The fluorescence lifetime of ATTO633 as a function of donor-quencher separation distance, measured from ensemble experiments. ATTO633’s lifetime drops from 4.16 ns (on ssDNA) to 2.01 ns (on dsDNA) when the dye-quencher distance is 8 bp. (c) Representative single-molecule lifetime traces of reporter strand-1 in 70 wt % glycerol solution at room temperature. The quencher strand concentration is 0.6 μM. Transient annealing and melting events are clearly manifested as the digital switch of fluorescence lifetime. (d) The lifetime histogram built from the lifetime traces in (c) also shows two states (3.60 ± 0.24 ns and 2.41 ± 0.18 ns, R2 = 0.87). The red curve in the upper panel shows the residuals from the two-peak Gaussian fit. (e) Apparent annealing (k′on) and melting (koff) rates extracted by ebFRET27. Dashed lines indicate linear fits. The annealing rate kon, which is the slope of the linear fit of k′on, is identified to be 5.13 ± 0.42 M−1s−1 whereas the melting rate koff is calculated to be 9.55 ± 0.64 s−1. Error bars represent standard deviations (SD) calculated from the SD of transition probabilities (Supplemental Note S6). R2 for kon fit is 0.98. The correlation coefficient between the quencher strand concentration and koff is −0.35, and the p-value for testing the null hypothesis that koff is independent of quencher concentration is 0.56 (≫0.05), indicating the null hypothesis is not rejected. Therefore, although koff is slightly reduced at higher concentration of the quencher strand (a linear fit between them also shows negative slope), the dependence of koff on quencher strand concentration is statistically insignificant.

