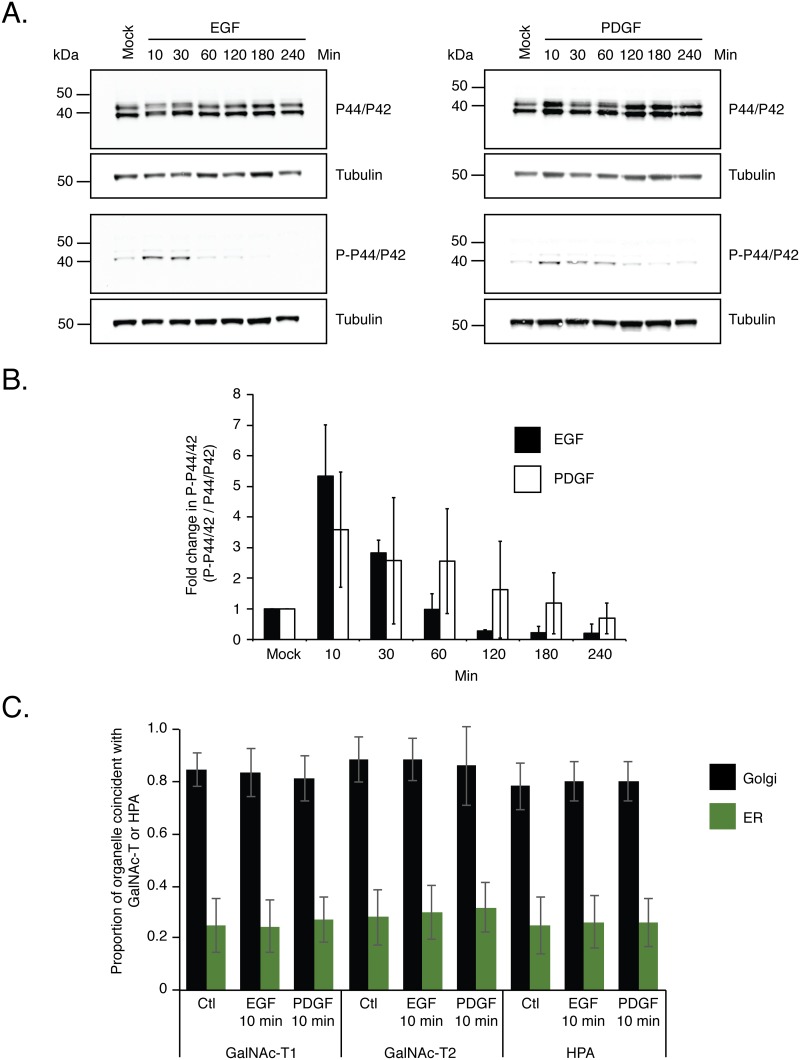
Fig 3. Time course of MAPK activation following growth factor treatments.
(A) Serum starved cells were left untreated, treated with 100 ng/ml of EGF or 50 ng/ml of PDGF. At varying time points after treatment cell extracts were prepared and subjected to Western blotting with antibodies specific for P44/P42 or phosphorylated P44/P42 (P-P44/P42) as an indicator of MAPK signalling. The time course revealed that the highest level of P-P44/P42 is detected 10 minutes after treatment. Western blots shown are representative of three independent experiments. (B) Quantification of fold change in detectable P-P44/P42 as a function of time after growth factor treatment. Average fold change in P-P44/P42 is shown with error bars representing the S.D. seen from the quantification of three independent western blots from three separate growth factor treatments. (C) Quantification of amount of GalNAc-T1, -T2 and Tn antigen found in Golgi complex or ER after 10 minutes of growth factor treatments. Manders’ correlation coefficient was calculated on the data set shown in S2 and S3 Figs. Values represent the mean ± S.D.

