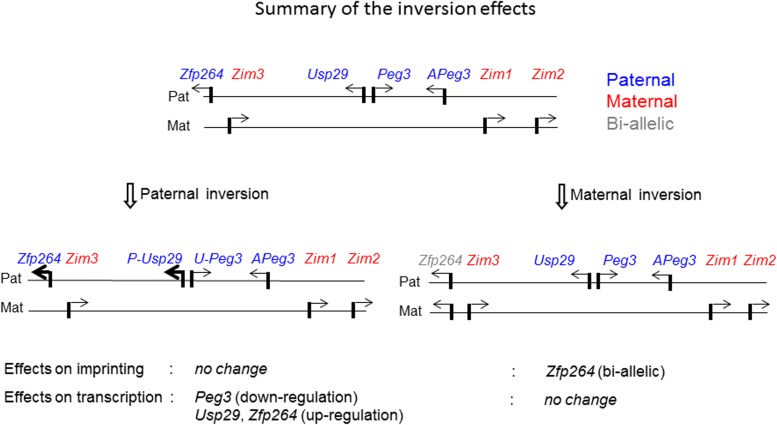
Fig 6. Summary of the inversion effects on the imprinting and expression of the Peg3 domain.
A schematic representation of the Peg3 domain is shown on the upper panel. Each imprinted gene is indicated with an arrow. The paternally and maternally expressed genes are indicated with blue and red, respectively. The bi-allelically expressed genes are indicated with gray. The mutational effects by the inversion of the Peg3-DMR with the paternal and maternal transmission are summarized with two schematic diagrams on the bottom panels. The mutational effects on the imprinting status and also expression levels were summarized using the results derived from the total RNA that had been isolated from the neonatal heads with both sexes.

