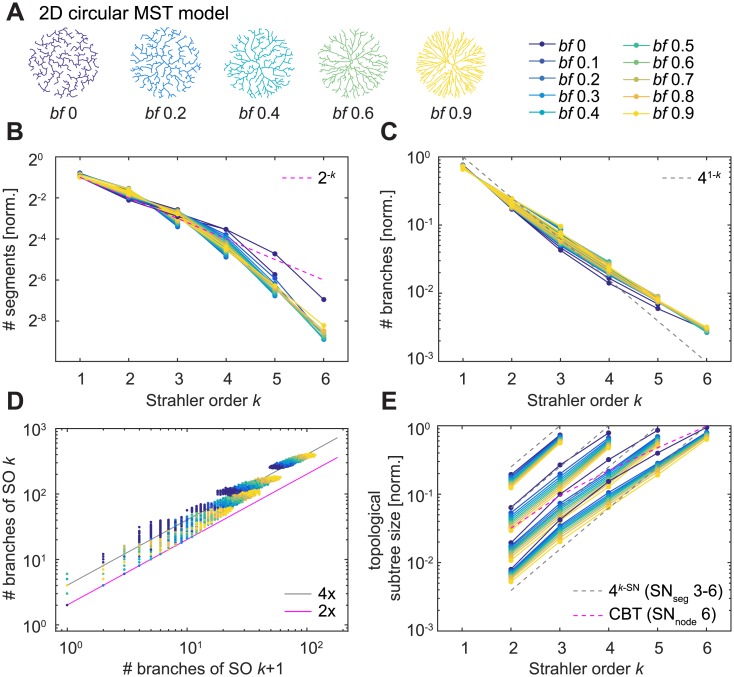
Fig 3. SO-sorted topological measures in minimum spanning trees (MSTs).
A. Example synthetic MST model dendrites (2D circular morphology) generated with 500 target points and differing balancing factors (bf). Colours and legend to the right indicate bf in the remaining panels. B—E. Similar plots to Fig 2G–2J. For B, C, and E, each line represents the mean of 614–970 (SN 3), 398–940 (SN 4), 625–967 (SN 5), and 248–964 (SN 6) model trees per bf. For better clarity, standard deviations are not shown.

