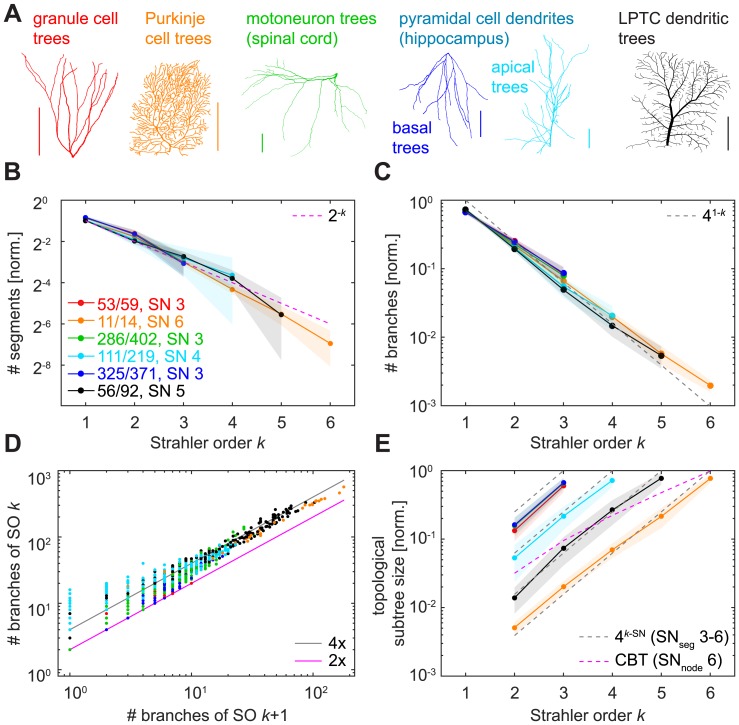
Fig 4. SO-sorted topological measures in real dendritic trees.
A. Example reconstructed morphologies of the six dendrite types that were analysed in this study. Colours indicate cell types in the remaining panels (red—granule cell; orange—cerebellar Purkinje cell; green—spinal cord motoneuron; cyan—hippocampal pyramidal cell, apical dendrite; blue—hippocampal pyramidal cell, basal dendrite; black—lobula plate tangential cell, LPTC). Scale bars always 100 μm. B—E. Similar plots to Fig 2G–2J. Legend in B shows number of dendritic trees used for the plot compared to the total number of trees analysed for that dendrite type. For each cell type, only averages of trees with one given (i.e. the most abundant) SN were plotted, except for panel D in which all investigated dendritic trees of a cell type were used. Shaded areas denote standard deviations.

