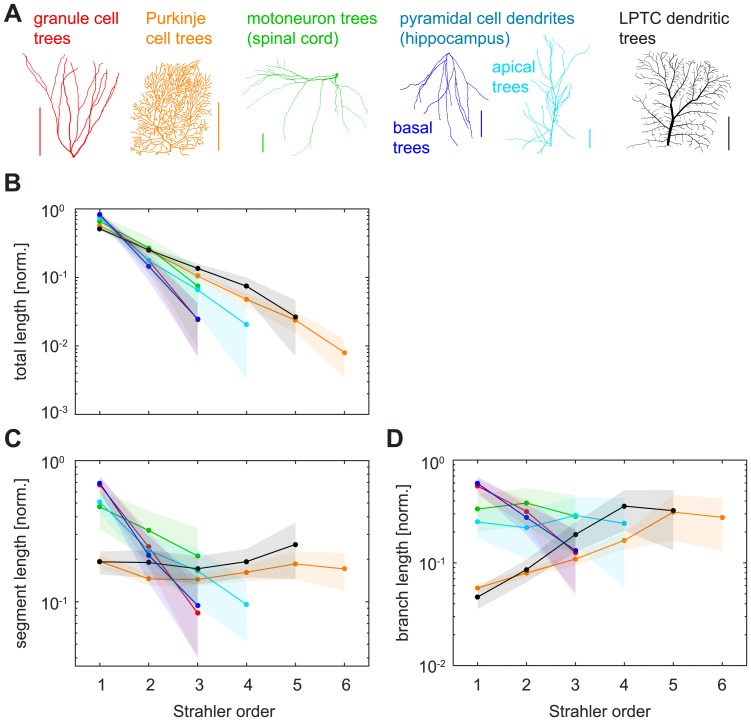
Fig 5. SO-sorted metric measures in real dendritic trees.
A. Legend; same as in Fig 4A. B. Average normalised total dendritic length as it distributes per SO in the reconstructed cell types from Fig 4. C. Average normalised segment lengths as they differ for different SO values. D. Average normalised branch lengths as they differ for different SO values. Shaded areas denote standard deviations.

