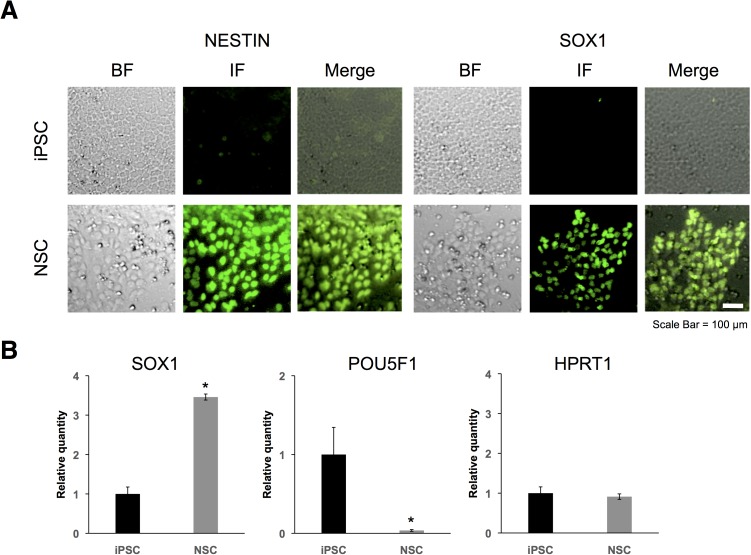
Fig 1. Immunostaining and RT-qPCR of neural stem cell (NSC) markers.
(A) Fluorescence images were obtained using a human NSC immunocytochemistry kit (Life Technologies). Cells were immunostained for NESTIN (green; left) and SOX1 (green; right). BF indicated bright field and IF indicated immunofluorescence. (B) Expression levels of SOX1, POU5F1, and HPRT1 in iPSCs (black bar) and in NSCs (gray bar) were determined by RT-qPCR. GAPDH, ACTB, HPRT1, and PGK1 were used for normalization. Values represent mean ± SD obtained from three independent experiments (*P < 0.05, Student’s t test).

