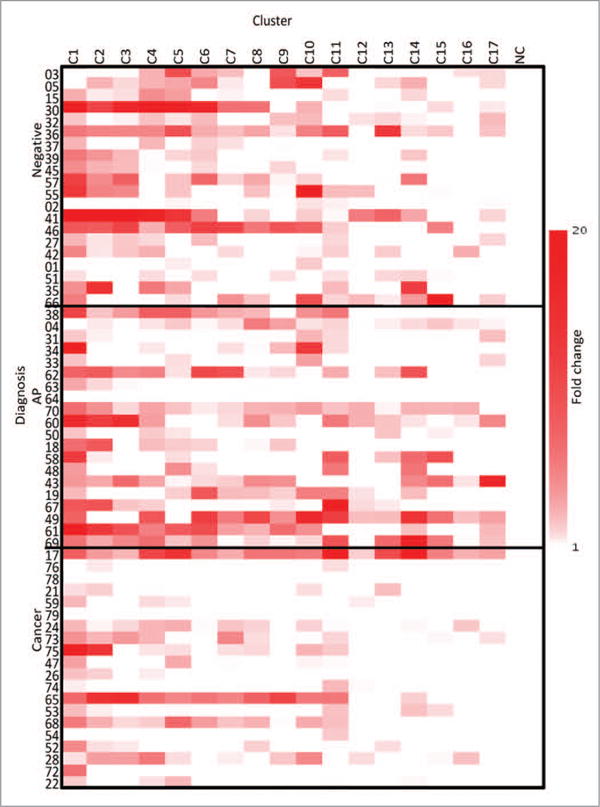
Figure 3.

IL-2-fold change heatmap. The fold change of the supernatant levels of IL-2 from the three groups compared with the NC, as evaluated on Day 2, NC is a negative control. The clusters are listed across the top and the three cohorts are listed on the y axis.
