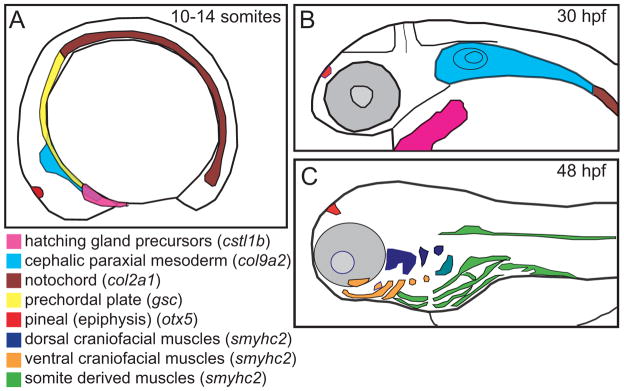
Figure 5. Regions of the head mesendoderm were assayed using a panel of markers.
Schematic representation of expression patterns of mesendodermal and mesodermal tissues along the anterior-posterior axis during (A) the early somite stage, (B) the mid pharyngula period, and (C) the onset of the hatching period. Lateral views, dorsal to the top. Schematics based on published gene expression data (Elworthy et al., 2008; Murakami et al., 2006; Thisse et al., 2001).

