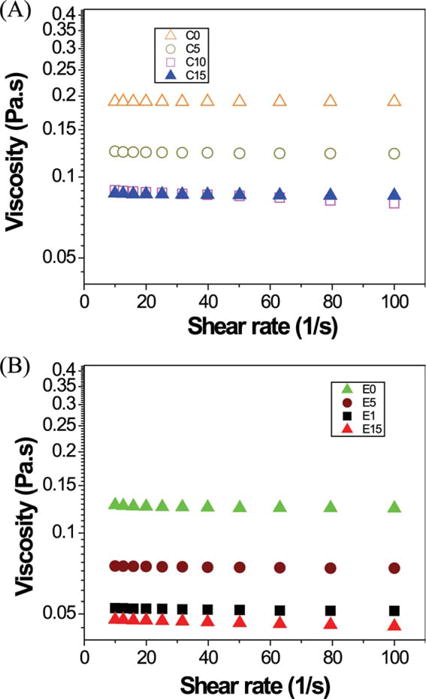
FIGURE 3.

The viscosities of control (A: C0, C5, C10, C15) and experimental adhesives (B: E0, E5, E10, E15) as a function of shear rate at 25°C. Control (C): BisGMA/HEMA: 55/45 wt %. Experimental (E): BisGMA/HEMA/BMPB: 30/45/25 wt%. Abbreviations: C, C5, C10, C15 represent control adhesive with 0, 5, 10, 15 wt % water; E, E5, E10, E15 represent experimental adhesive with 0, 5, 10, 15 wt % water. [Color figure can be viewed in the online issue, which is available at wileyonlinelibrary.com.]
