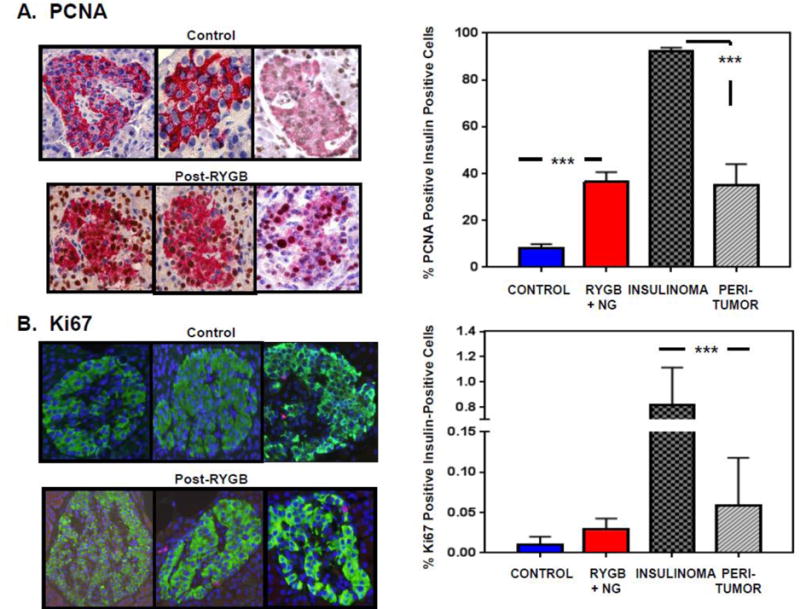
Figure 2.

Representative images (left) and quantification (right) for (A) PCNA and (B) Ki-67 staining, expressed as percentage of insulin-positive cells in samples from controls (n=6), patients with RYGB+NG (n=11 for PCNA, 12 for Ki-67). These data are compared with neoplastic cells from patients with insulinoma (n=7), and with surrounding non-neoplastic islets. 1000–2000 β-cells were counted for each patient. *** indicates p<0.0001.
