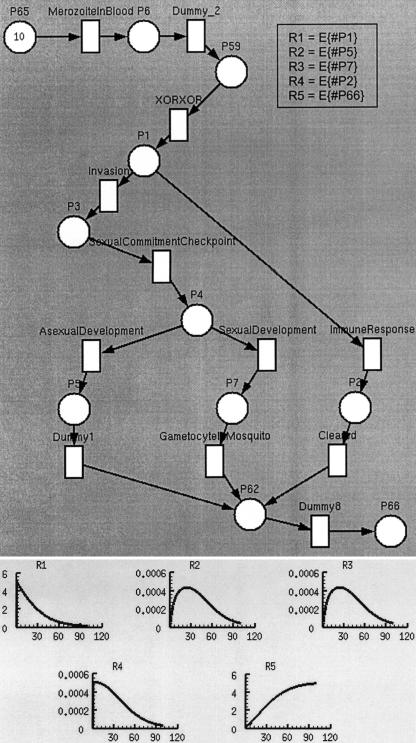
Figure 1.
TimeNet's representation of the malaria example and the results of kinetic experiments, corresponding to this Petri Net (PN). Places are represented as circles and transitions as squares. The number 10 written inside the place P65 represents a marking of ten tokens that correspond to ten malaria parasites (merozoites). In this marking of the PN, only the transition MerozoiteInBlood is enabled because there are tokens in all its input places (in the case of this transition, there is only one input place: P65). When this transition fires, a token is passed from the input place P65 to all the output places. In this case, there is only one output place: P6. Tokens that reach place P1 may flow either through the transition Invasion or the transition ImmuneResponse. In the graph shown below the PN, the y-axis shows the values of the performance measures (average number of tokens at certain places) from time zero to a given time on the x-axis. These kinetic curves use a smoothing function, which does not measure the number of tokens at a given time but rather the average number of tokens over a time interval. R5 is a hyperbolic curve showing sink places that accumulate all the tokens in the system. The curve corresponds to place P66. R2 and R3 are parabolic curves showing transient stages. Tokens gradually enter these stages, stay there for a while, and then transition to the next stage. The curves correspond to places P5 and P7, respectively. R1 and R4 are curves showing stages that start with many tokens and lose them over time. The curves correspond to places P1 and P2, respectively.

