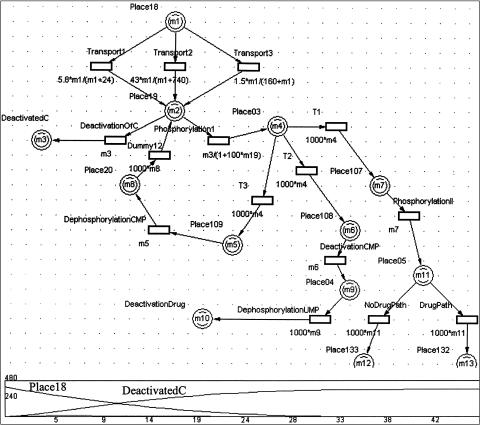
Figure 6.
Part of the Genomic Object Net's Petri Net of the gemcitabine example shown in ▶ and some of the graphs produced that follow the number of tokens at some places as a function of time. These graphs were produced by the Cell Illustrator tool, version 1.02, which is a new version of Genomic Object Net, which has better capabilities but is not freely available.

