
Figure 2. Tubulin waves generate large forces.
(a, b) Mean pulse risetime versus force (a) and distributions of risetime at indicated forces (b) for wild-type microtubules. The mean risetime across all forces is depicted by the dashed line in (a). (c, d) Mean pulse amplitude versus force (c) and distributions of amplitude at indicated forces (d) for pulses generated by wild-type yeast microtubules. Total pulse energy, W, is estimated from the area under the line-fit in (c), shaded grey. Error bars show standard errors (for N = 6 to 87 amplitudes; N = 3 to 78 risetimes). All data in (a - d) were collected using 900 nm beads.

Figure 2—figure supplement 1. Properties of wild-type tubulin waves measured using different bead sizes.
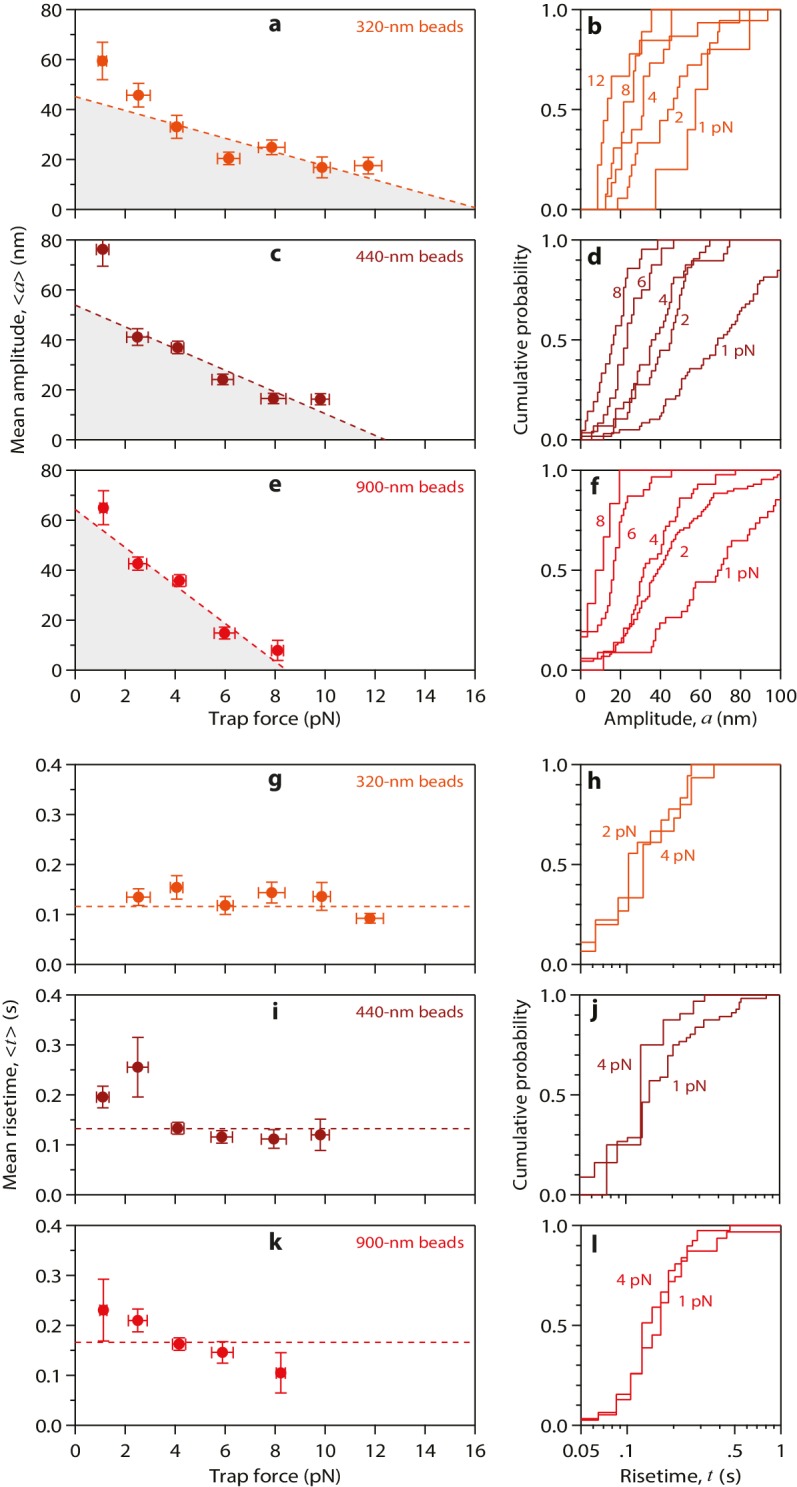
(a – f) Mean amplitudes versus force (a, c, e) and distributions of amplitude at indicated forces (b, d, f) for pulses generated by wild-type yeast microtubules, measured with 320 nm beads (a, b), with 440 nm beads (c, d), and with 900 nm beads (e, f). (g – l) Mean pulse risetimes versus force (g, i, k) and distributions of risetime at indicated forces (h, j, l) for wild-type microtubules measured with 320 nm beads (g, h), with 440 nm beads (i, j), and with 900 nm beads (k, l). Dashed lines in (a, c, and e) show fits used to estimate the stall forces, unloaded amplitudes, and total pulse energies (shaded gray areas), which are plotted against bead size in Figure 4a–c. Horizontal dashed lines in (g, i, and k) show mean risetimes across all forces, which are plotted against bead size in Figure 4d and e. Error bars show standard errors (for N = 5 to 87 amplitudes; N = 3 to 78 risetimes).