Figure 5. Hyperstable mutant microtubules produce slower pulses.
(a) Superposition of polymerized (’straight’, green) and unpolymerized (’curved’, blue) conformations of β-tubulin. Residue T238 is inaccessible to solvent and located on a helix (H7) that undergoes piston-like movement between the straight and curved conformations (which are represented by PDB entries 3JAT and 1SA0, respectively). GDP nucleotide is shown in red. (b, c) Example record showing trap force (b) and bead displacement (c) versus time for a mutant T238V microtubule. Grey trace shows raw bead-trap separation after converting to force by multiplying by the trap stiffness. Black trace shows same data after smoothing with a 250 ms median filter. The pulse amplitude, a, and risetime, t, are indicated. (d) Gallery of additional example records for mutant T238V microtubules, measured at the indicated levels of tension. Data in (b - d) were collected using 900 nm beads. Note the different time scales here in comparison to Figure 1c–e.

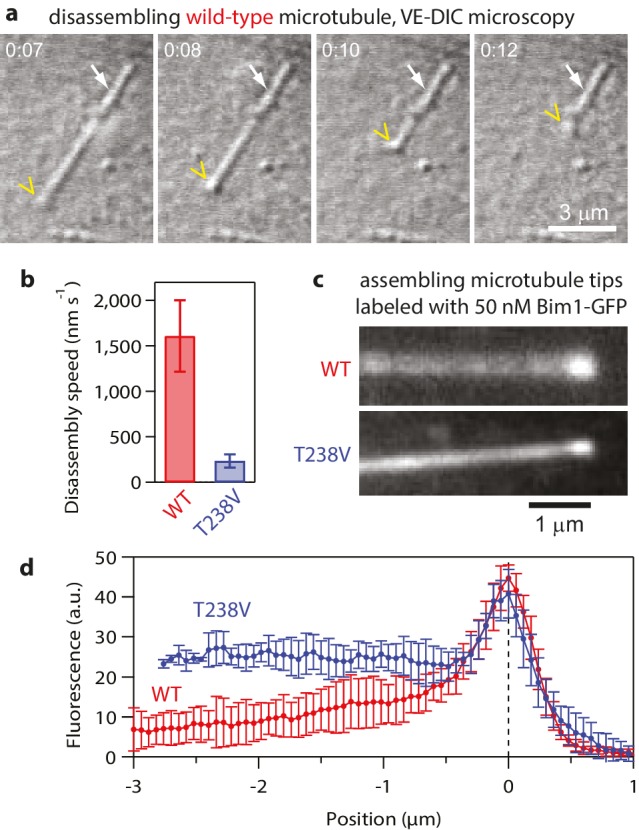
Figure 5—figure supplement 1. Hyperstable mutant T238V tubulin disassembles more slowly than wild-type.