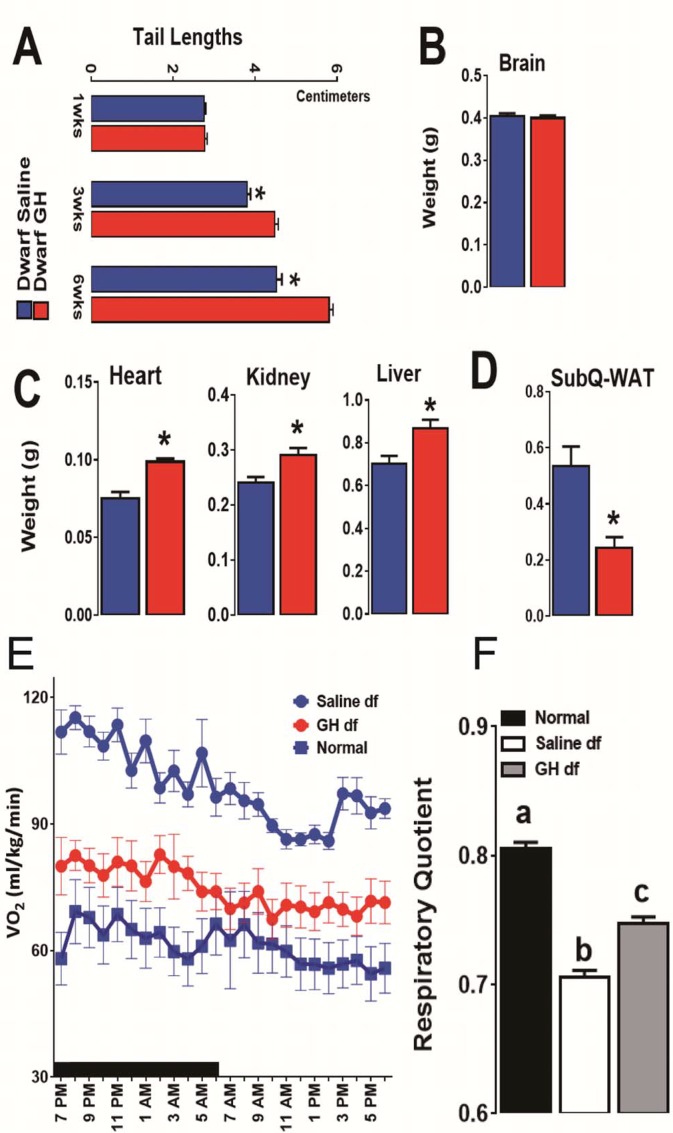
Figure 4. Impact of early-life GH treatment on physiological characteristics.
(A) Tail lengths; the weights of (B) Brain, (C) Heart, Kidney and Liver and (D) Subcutaneous White Adipose Tissues weights presented as absolute values. (E) VO2 values plotted as hourly averages representing either dark or light periods. (F) RQ = respiratory quotient values. each bar represents means ± SEM for 8–10 mice per group. *p<0.05, **p<0.01, Data from male mice are presented.

