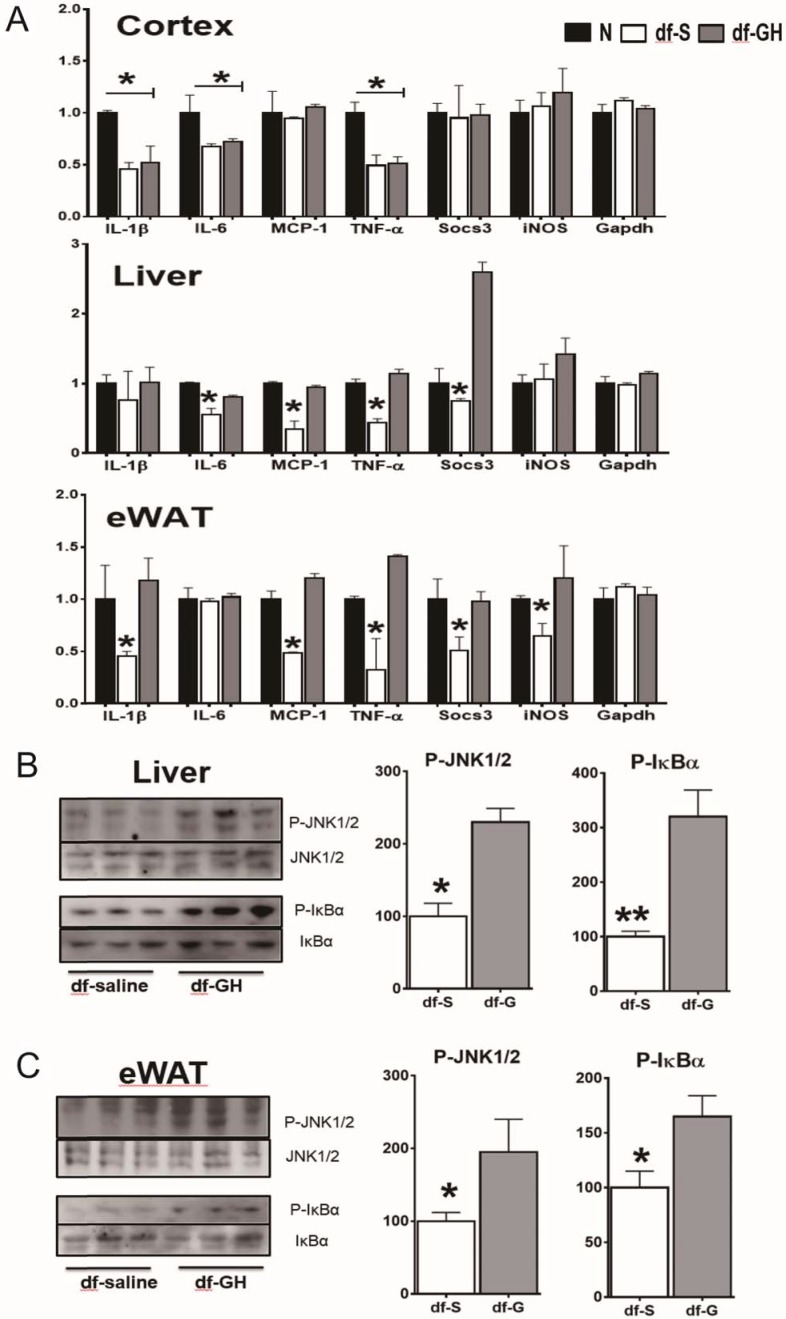
Figure 7. Long-term effects on tissue inflammatory markers.
(A) Effects of early GH treatment on the expression of various inflammatory indices (IL-6, IL-1β, MCP-1, TNF-α, Socs3 and iNOS in WAT, liver, and cerebral cortex by qRT-PCR. Data are normalized to GAPDH or actin values and expressed as a ratio (fold change) to levels of mRNA in control mice. (B) Representative Western blots for phosphorylated and total forms of JNK and IkB in liver and eWAT lysates of dwarf subjected to GH or saline treatment. N = 8 male mice per group; *p<0.05, **p<0.01, ***p<0.001.

