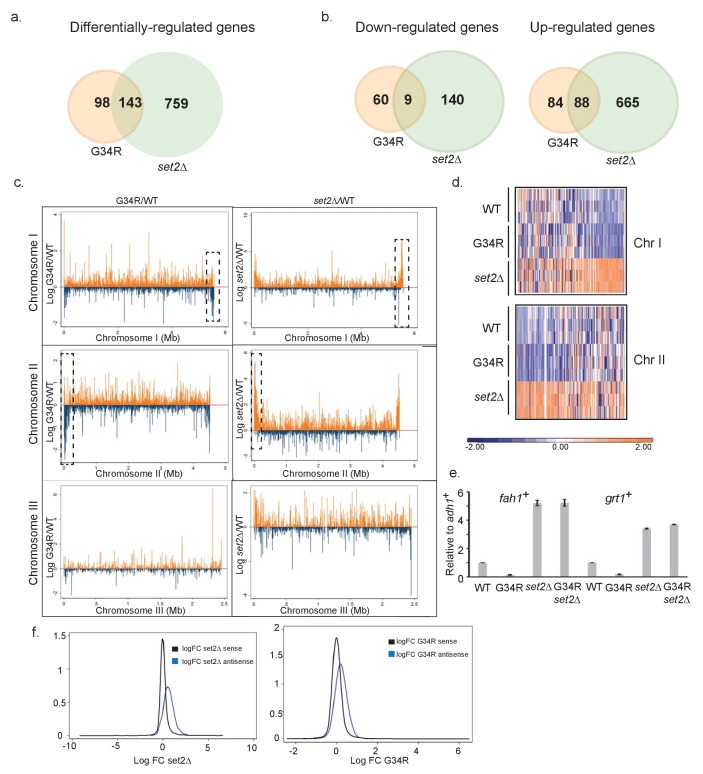
Figure 2. H3-G34R mutants show a distinct transcriptional profile to set2Δ cells.
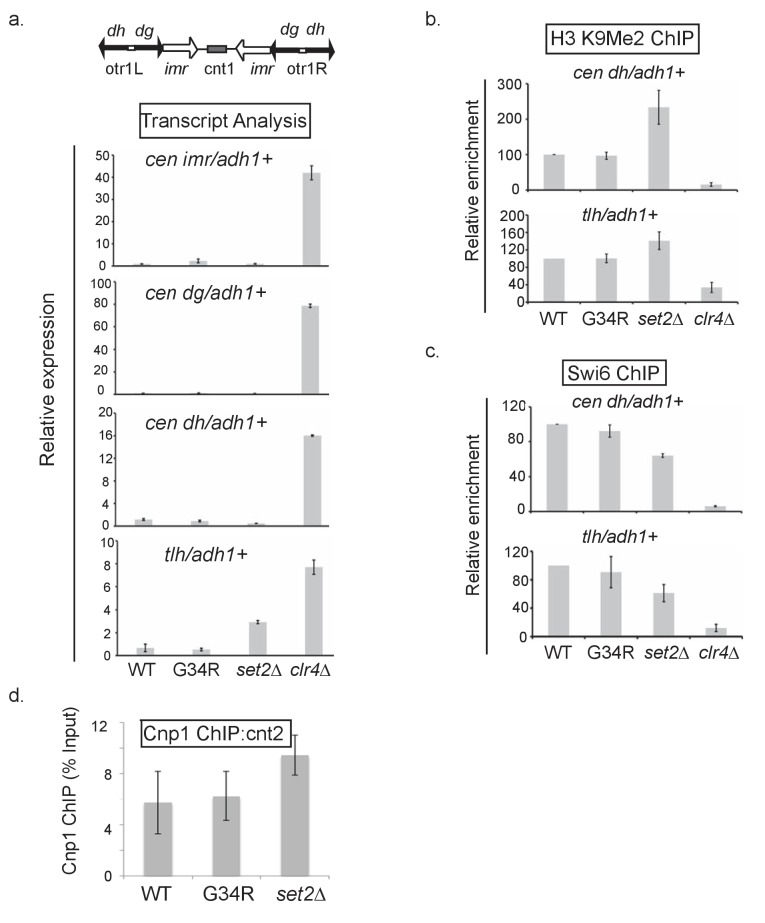
Schematic of genes that are (a) differentially-regulated, or (b) similarly down-regulated or up-regulated comparing either H3-G34R or set2Δ cells with H3-WT cells in RNA-seq analyses. Triplicate biological replicates were analyzed with cut-offs of 1.5 fold differences in expression, and false discovery rates of 5%. (c) RNA-seq profiles for chromosomes I, II, and III comparing Log fold change ratios for H3-G34R/H3-WT or set2Δ/H3 WT plotted against chromosome coordinates. (d) Zoomed-in regions of RHS Chr I (5.3 Mb-end, top) and LHS Chr II (first 300 Kb, bottom) as depicted in the boxed regions in (c) showing log FC data for individual biological replicates. (e) RT-PCR validation of fah1+ and grt1+ expression relative to adh1+ expression. (f) Density plots of RNA seq reads for sense (black) and antisense transcripts (blue) against log fold change ratios for set2Δ/H3 WT (left) and H3-G34R/H3 WT (right). Please see Figure 2—figure supplement 1 for analysis of heterochromatic loci, and Supplementary file 3 for full RNA-seq analysis results.


