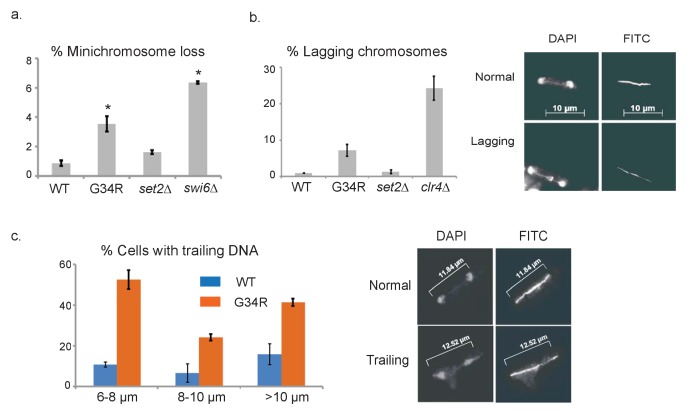
Figure 3. H3-G34R cells exhibit genomic instability.
(a) Frequency of cells that lose the non-essential minichromosome Ch16 in H3-WT, H3-G34R, set2Δ and swi6Δ cells. Asterisk indicates significant difference from H3-WT (p<0.05). Mean ± SEM from 4 experiments shown. (b) Frequency of late anaphase cells that show a lagging chromosome in H3-WT, G34R, set2Δ, and clr4Δ. Mean ± SEM from 2 experiments shown. G34R and clr4Δ have small p values (0.1) although not significantly different from WT (c) Frequency of cells with chromosome segregation defects in H3-WT and H3-G34R cells. Cells were synchronized using nda3-KM311 and chromosome segregation phenotypes were scored in cells with different spindle lengths. Data are represented as mean ± SD from 2 biological replicates. Right panels depict representative images of (b) normal and lagging or (c) ‘trailing’ chromosomes (DAPI = DNA; FITC = tubulin).

