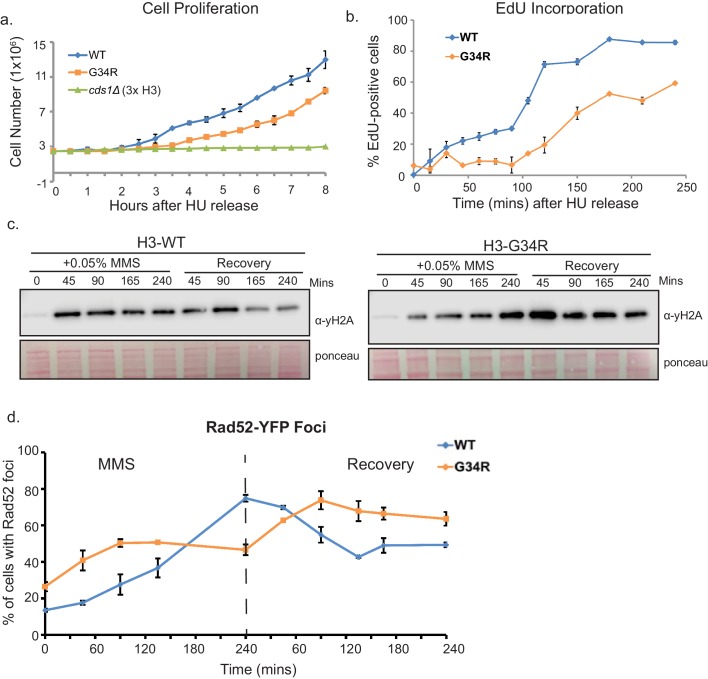
Figure 7. H3-G34R mutants exhibit delayed recovery from replicative stress.
(a) Cell proliferation of H3-WT, H3-G34R, and cds1Δ cells was analyzed after synchronization in 11 mM HU for 4 hr. Cells were counted at 30 min intervals following release. Results represent average of 2 independent experiments, with error bars reflecting SEM (H3-WT and H3-G34R) and a single cds1Δ experiment. (b) Measure of EdU labeling of newly synthesized DNA. Cells were modified to incorporate nucleotide analogs. WT and G34R cells were synchronized in 11 mM HU for 4 hr and released into fresh media containing EdU and collected and ethanol fixed over a time course. EdU was labeled by ClickIT with Alexa Fluor 488 and samples were analyzed by FACS, gating on cells that fully incorporated EdU. Assay was performed twice, and each sample was read three times. Data from one experiment is shown, with values representing means of triplicate reads with background from control samples subtracted. Error bars represent SD. (c–d) Time course to analyze (c) γH2A by western blotting or (d) Rad52 (Rad52-GFP) foci formation in H3-WT and H3-G34R cells during treatment with 0.05% MMS and recovery. For (d), error bars represent SEM for 2 independent experiments, and the time course for γH2A westerns was repeated twice.

