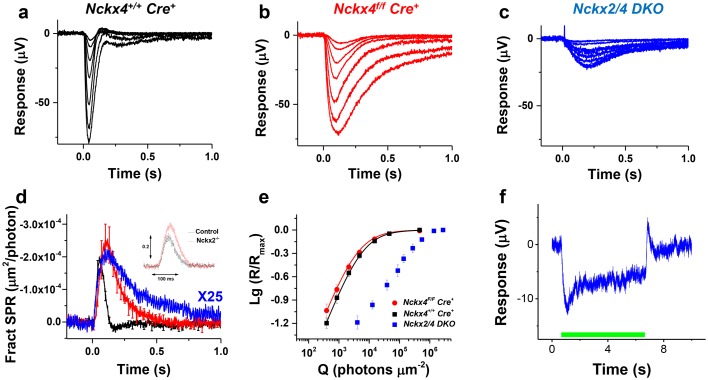
Figure 9. Loss of both NCKX2 and NCKX4 expressions severely compromises cone function.
Representative light responses recorded from isolated retinas of Nckx4+/+ Cre+ (a), Nckx4f/f Cre+ (b) and Nckx2-/- Nckx4f/f Cre+ (c) mice using ex vivo ERG method. Light flashes ranged from 390 to 460,000 photons (505 nm) μm−2 in (a) and (b), and from 4000 to 1.4 * 106 photons (505 nm) μm−2. (d) Population averaged (mean ± SEM) responses to a dim flash normalized with Q (in photons μm−2) and maximal response amplitude (Rmax) recorded from Nckx4+/+ Cre+ control (black, N = 5 retinas from four mice), Nckx4f/f Cre+ (red, N = 8 retinas from four mice) and Nckx2-/- Nckx4f/f Cre+ (blue, N = 4 retinas from three mice) retinas. The response from Nckx2-/- Nckx4f/f Cre+ mice shown in (d) is scaled up by 25-fold to facilitate comparison of response kinetics between the genotypes. The inset shows fractional dim flash responses of control (WT) and Nckx2-/- cones modified from (Sakurai et al., 2016). (e) Normalized population averaged response amplitudes (R/Rmax) are plotted as a function of flash strength in photons μm−2 for Nckx4+/+ Cre+ control (black, N = 5), Nckx4f/f Cre+ (red, N = 8), and Nckx2-/- Nckx4f/f Cre+ (blue, N = 4) mouse retinas. Smooth traces plot Eq. 3 with Q1/2 = 5200 photons μm−2 and 3900 photons μm−2 for control (black) and Nckx4f/f Cre+ (red) retinas, respectively. (f) Light adaptation persists in the cones from Nckx2-/- Nckx4f/f Cre+ mice. Representative response to a bright step of 530 nm light (I = 38,600,000 photons μm−2 s−1) recorded from Nckx2-/- Nckx4f/f Cre+ mouse retina. Light step timing is indicated on the bottom of the graph.

