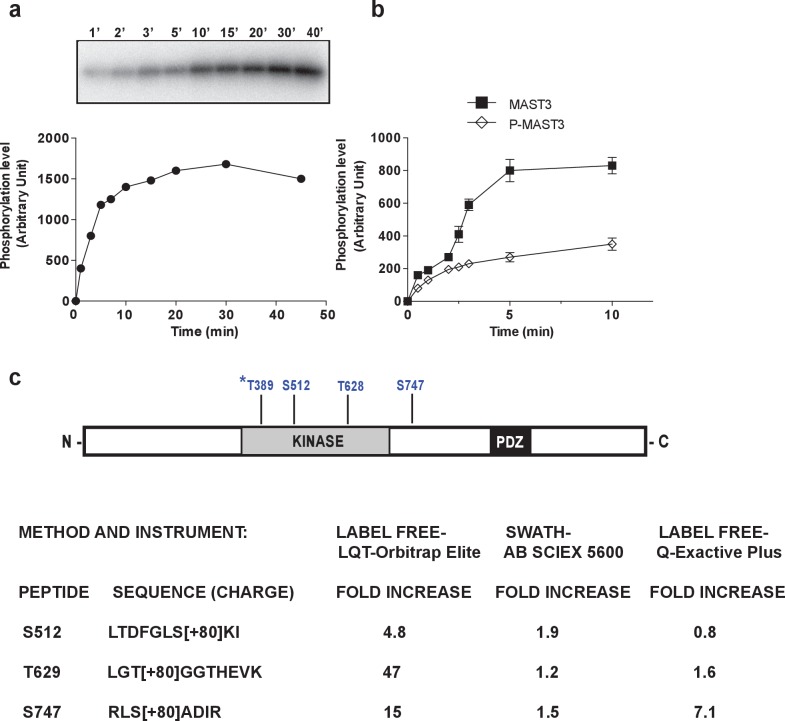
Figure 4. MAST3 phosphorylation by PKA in vitro inhibits MAST3 kinase activity; summary scheme of mass spectrometry results showing phosphorylation sites in MAST3.
(a) MAST3-HA kinase (overexpressed in HEK293T cells and immunoprecipitated), was incubated with ATP-γ-32P and PKA for various times; proteins were separated by SDS-PAGE and phosphorylation of MAST3-HA was measured by autoradiography (upper panel). Summary data (lower panel) are expressed in arbitrary densitometric units (a.u.) as mean ± SE of five independent experiments. (b) MAST3-HA was pre-incubated without (MAST3) or with PKA (P-MAST3) and ATP for 30 min. Recombinant purified ARPP-16 (100 nM) was incubated with P-MAST3 or MAST3 in the presence of ATP-γ-32P, for various times; proteins were analyzed as described in panel a. The resulting values for phosphorylation are expressed in arbitrary densitometric units (a.u.) as mean ± SE of three independent experiments. (c) The domain structure of MAST3 is illustrated. The position of the four phosphorylation sites studied are indicated. MAST3-HA was overexpressed in HEK293T cells and incubated in the absence or presence of 10 μM forskolin (FSK) for 30 min. MAST3-HA was isolated by immunoprecipitation and the samples analyzed by LC-MS/MS. The fold-change increase in phosphorylation of S512, T628 and S747 was assessed by different proteomic methods, namely LABEL FREE or SWATH, on different mass spectrometers. Data are presented as –fold change in peptide phosphorylation in response to forskolin compared to control. *T389: Phosphorylation of T389 was identified but not quantitated.

