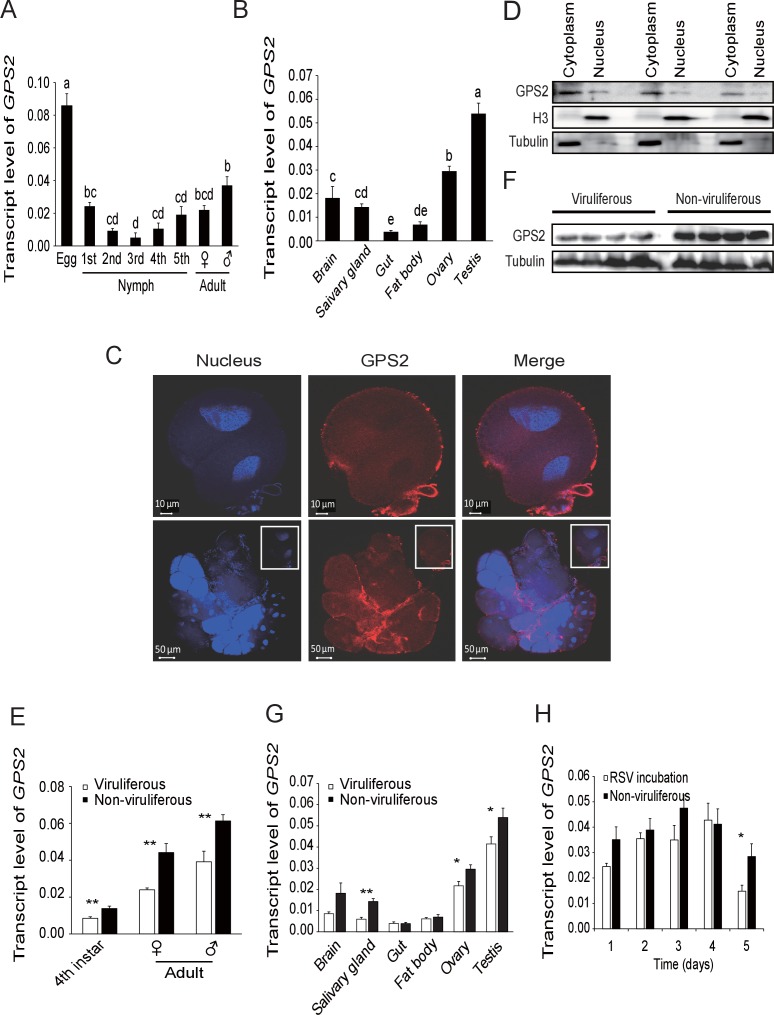
Figure 2. Temporal, spatial and subcellular expression of GPS2 in the planthopper.
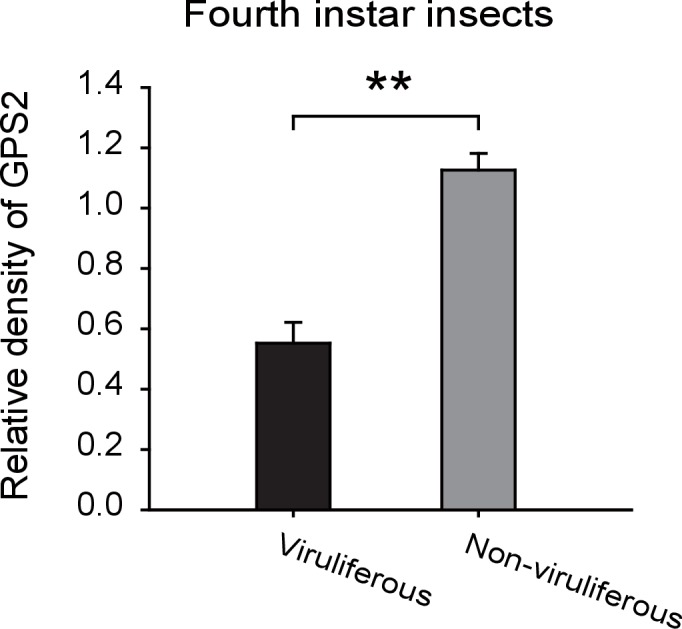
(A) Relative transcript levels of GPS2 throughout the developmental stages of non-viruliferous planthoppers. (B) Relative transcript levels of GPS2 in various tissues of non-viruliferous planthoppers. The transcript levels of GPS2 are normalized to that of the ef2 transcript. Different letters indicate significant differences in Tukey’s multiple comparison test. (C) Subcellular localization of GPS2 in the salivary gland cells of non-viruliferous planthoppers revealed by an anti-human GPS2 polyclonal antibody in immunohistochemistry. Red is the positive signal. Nuclei are stained blue. (D) Western blotting showing GPS2 in the nuclei and cytoplasm of cells in insect whole-body samples. Reference proteins for nuclear and cytoplasmic proteins were histone H3 and tubulin, respectively, which were displayed using an anti-human H3 monoclonal antibody and an anti-human tubulin monoclonal antibody. (E) Comparison of relative transcript levels of GPS2 between viruliferous and non-viruliferous fourth instar nymphs, females and males. (F) Western blotting showing GPS2 protein in fourth instar nymphs of viruliferous and non-viruliferous planthoppers. (G) Comparison of relative transcript levels of GPS2 between the viruliferous and non-viruliferous various tissues. (H) Relative transcript levels of GPS2 when RSV is incubated within the insects for five days. *p<0.05; **p<0.01.
DOI: http://dx.doi.org/10.7554/eLife.26591.005
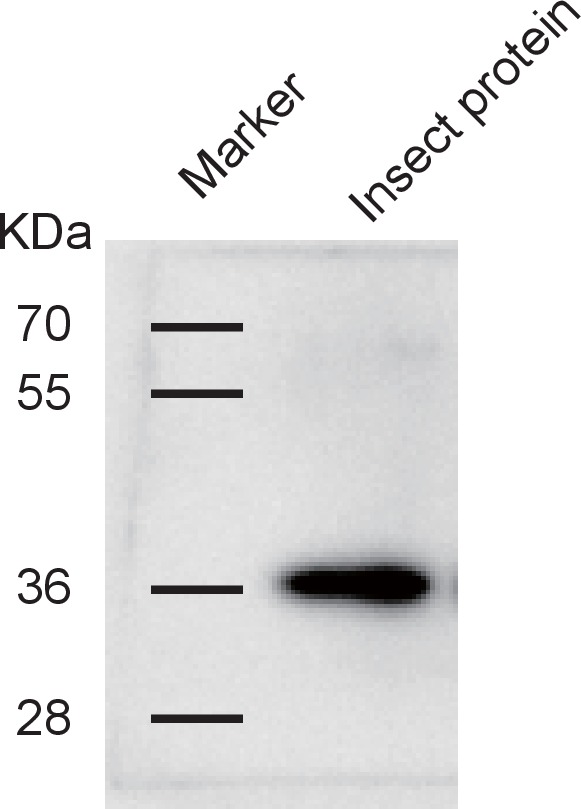
Figure 2—figure supplement 1. Western blotting to show the specificity of the anti-human GPS2 polyclonal antibody for recognizing planthopper GPS2.

Figure 2—figure supplement 2. Densitometry analysis for the GPS2 image bands from Figure 2F.


