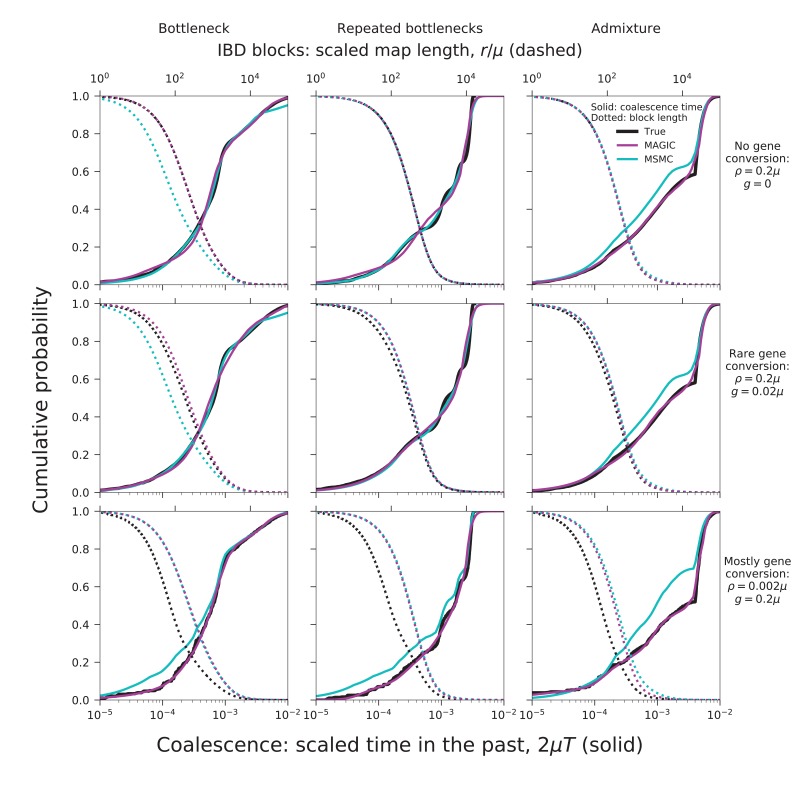
Figure 2. MAGIC accurately infers the distribution of coalescence times (solid curves) and lengths of blocks of identity-by-descent (IBD, dotted curves) for pairwise data simulated with ms under several demographic scenarios (Figure 9): a single bottleneck (left column), repeated expansions and contractions (middle), and recent admixture of two diverged populations (right).
The coalescence time plots show the cumulative distribution, while the IBD block-length plots show the survival function. When crossovers are frequent and gene conversion is rare (top two rows), MAGIC and MSMC are comparably accurate for coalescence times. MAGIC very accurately infers the IBD block length distribution, while MSMC sometimes is inaccurate (e.g., ‘Bottleneck’ scenario), but otherwise produces a curve nearly indistinguishable from MAGIC’s. For frequent gene conversion and rare crossovers (bottom row), the details of the gene conversion process have a strong effect on the IBD block lengths, and neither method can infer their distribution, but MAGIC can still infer the coalescence times. All simulations are of a genome consisting of independent chromosomes, each base pairs long, with per-base mutation rate and present population size such that . Recombination is via crossovers occurring at rate per base, and via gene conversion being initiated at rate per base with mean tract length . See Materials and methods for values of other simulation parameters.

