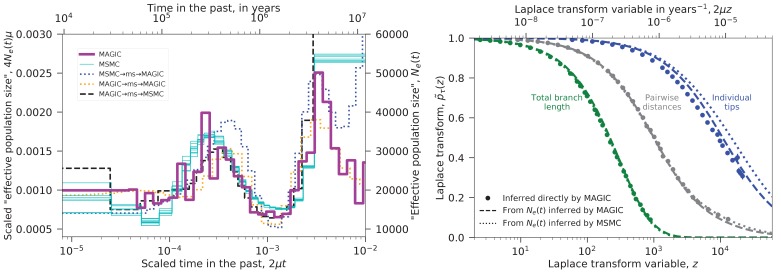
Figure 4. Inferred evolutionary history of Yoruban individuals.
Left: Inferred ‘effective population size’ for the nine unrelated Yoruban individuals from the 69 Genomes data set (Drmanac et al., 2010). MAGIC’s inference from the full sample is similar to MSMC’s inference from each individual, differing mostly in the distant past where there is limited data. Dotted lines show inference from samples simulated under the inferred ’s, indicating that MAGIC’s inference in the distant past is likely to be more accurate than MSMC’s, but that its inference of the fine-scale structure in is unreliable. Right: Laplace transforms of the distributions of different coalescence times for the same sample. The pairwise coalescence time (corresponding to in the left plot) is in gray, while the total branch length is in green and the distribution of tip lengths is in blue. Points show the values inferred directly by MAGIC, while solid and dashed curves show the results of simulations based on the curves inferred by MAGIC and MSMC, respectively. The pairwise accurately describes the distribution of total branch lengths, but overestimates the tip length Laplace transform (i.e., underestimates the tip lengths). MAGIC’s overestimate roughly corresponds to a underestimate of the median tip length, while MSMC’s corresponds to a underestimate, indicating that both underestimate recent from pairwise data.

