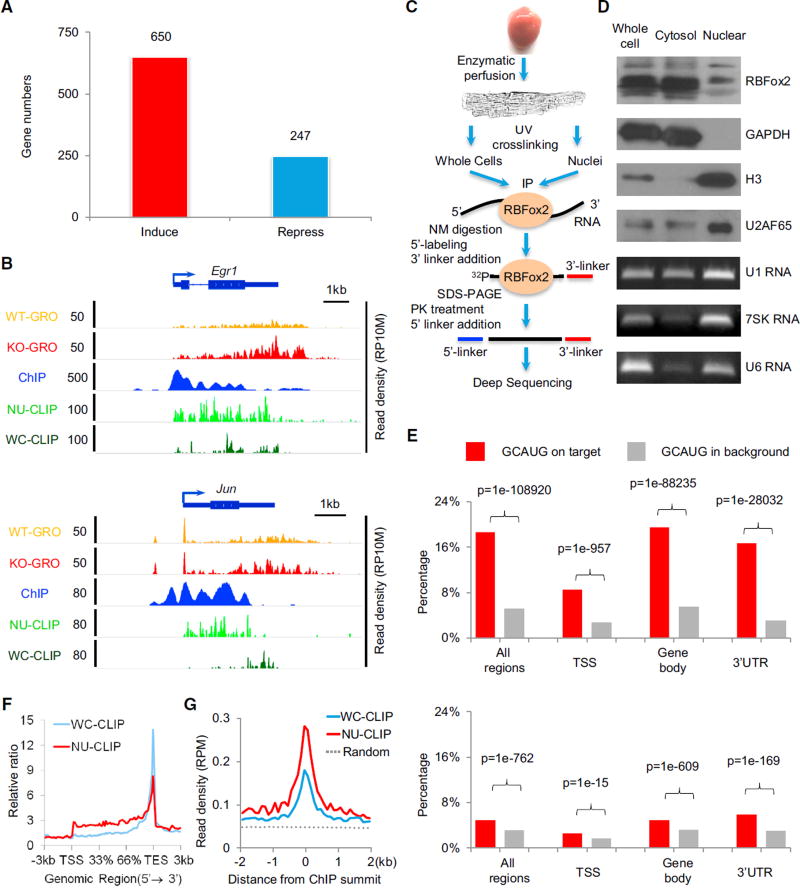
Figure 1. RBFox2 Knockout-Induced Transcription in Primary Cardiomyocytes.
(A) Significantly induced and repressed genes in RBFox2 knockout cardiomyocytes. The data are based on a >1.5-fold change and p value < 0.1 from GRO-seq analysis. See also Figures S1A–S1C.
(B) RBFox2 knockout-induced gene expression detected by GRO-seq in comparison with RBFox2-RNA interactions detected by CLIP-seq and RBFox2-DNA interactions detected by ChIP-seq on two representative protein-coding genes, Egr1 and Jun. All experiments were on isolated cardiomyocytes from 9-week-old mice. The scale on they axis indicates the read density per 10 million of total normalized reads (RP10M). See also Figure S1D and Table S1.
(C) Diagram showing key steps in CLIP-seq analysis on whole-cell or nuclear-enriched cardiomyocytes.
(D) Characterization of fractionated cardiomyocytes by western blotting using both cytoplasmic (GAPDH) and nuclear proteins (histone H3 and U2AF65) and RNAs (U1, 7SK, and U6) as markers.
(E) Distribution of the GCAUG motif in RBFox2 WC CLIP-seq reads (top) or NU CLIP-seq reads (bottom) in different regions of RefSeq coding genes (red bars) relative to background (gray bars). TSS, transcription stare site to +/−1 kb downstream regions; gene body, regions in RefSeq coding genes without a TSS and 3′ UTR. See also Figures S1E and S1F.
(F) Meta-gene analysis of whole-cell (WC; blue) and nuclear (NU; red) RBFox2 CLIP-seq signals on all RefSeq protein-coding genes by the ngsplot program.
(G) Alignment of the WC (blue) and NU (red) RBFox2 CLIP-seq signals on the center of RBFox2 ChIP-seq signals. Randomized signals (dashed line) served as control.

