
Fig. 3. Sna downregulates Baz in mesoderm cells prior to gastrulation.
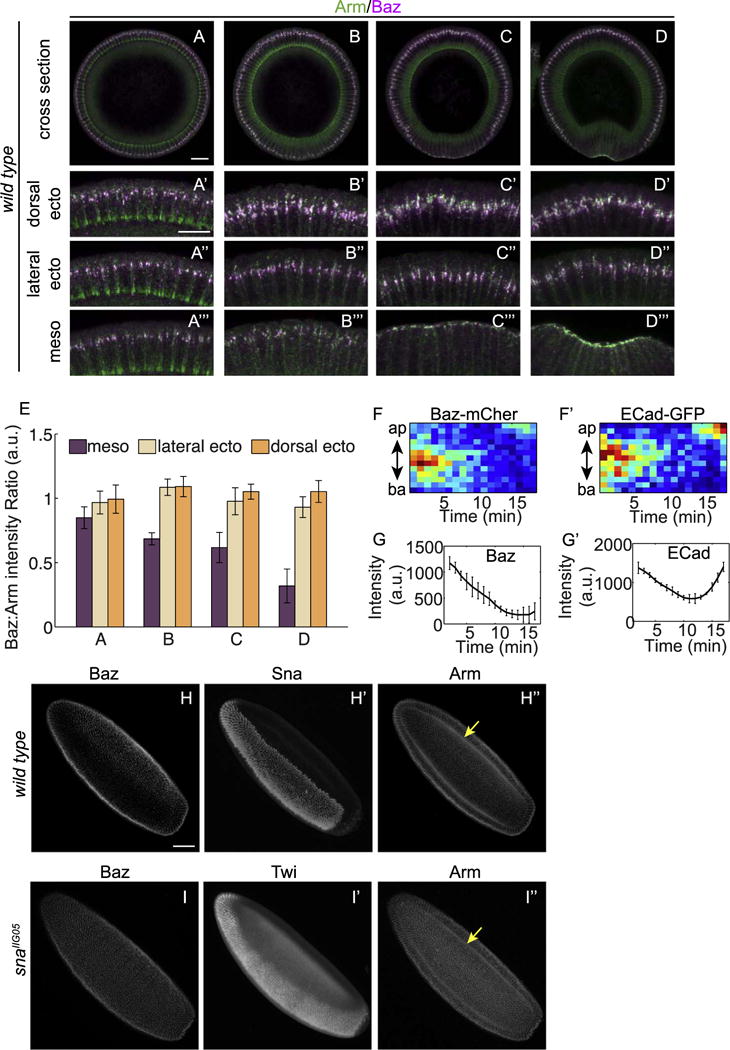
(A–D) Wild type embryos at different stages of development from mid-cellularization (A), late cellularization (B), to gastrulation (C–D). Zoom-in images show cells from the dorsal (A′–D′), lateral (A″–D″) and ventral (A‴–D‴) regions. Images have been rotated so that the cells are of the same orientation with the apical side up. All zoom-in images are of the same setting to allow comparing the ratio between Baz and Arm in the three regions of the same embryo. Compared to dorsal and lateral sides, the merged images of ventral cells become increasingly greener indicating the Baz:Arm ratio becomes lower as the embryos develop. Scale bars: 20 μm (A–D) and 10 μm (A′–D′, A″–D″, A‴–D‴). (E) Ratios between Baz and Arm fluorescent intensity in mesoderm and ectoderm of fixed embryos at similar stages as embryos in A–D. For the ratios at each stage, at least three embryos are quantified. (F) Kymograph of Baz-mCherry (F) and E-Cad-GFP (F′) in ventral cells from late cellularization to gastrulation. (G) Total intensity of Baz-mCherry and E-Cad-GFP in ventral cells from later cellularization to gastrulation. Average values from 3 embryos are shown. (H) In wild type embryos, Baz is downregulated in mesoderm cells identified by their Sna staining (H′). (I) In sna mutant embryos Baz pattern is indistinguishable between ectoderm and mesoderm, in this cases, identified by Twist (Twi) staining (I′). Scale bar: 50 μm.