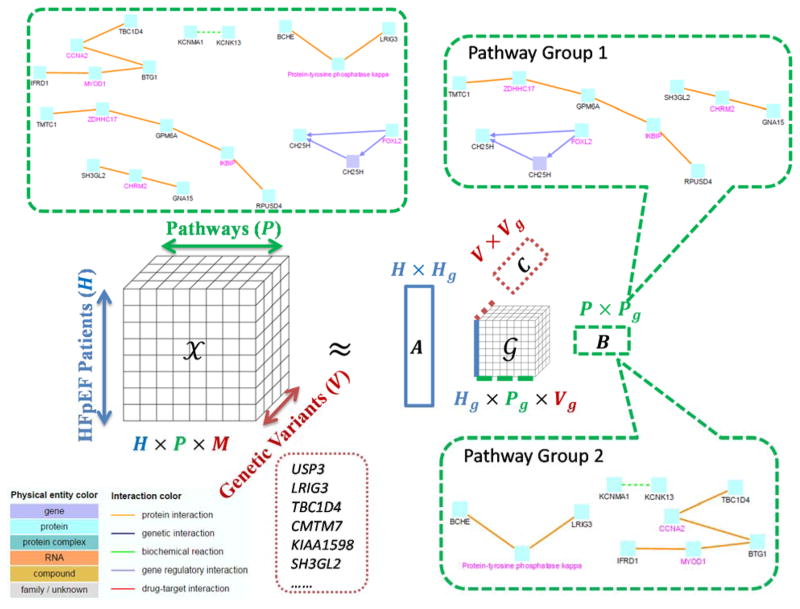
Figure 3. Tensor model for hierarchical genetic pathway analysis to subtyping HFpEF patients.
In the figure, we show the pathway features and genetic variant features as separate modes. The left hand side is the tensor modeling. The right hand side is the Tucker factorization results, which include a core tensor and three factor matrices. The factor matrix A is the 〈patient, patient group〉 matrix, B the 〈pathway, pathway group〉 matrix, C the 〈variant, variant group〉 matrix. The core tensor 𝒢 captures the interactions between the patient groups, pathway groups and variant groups.

