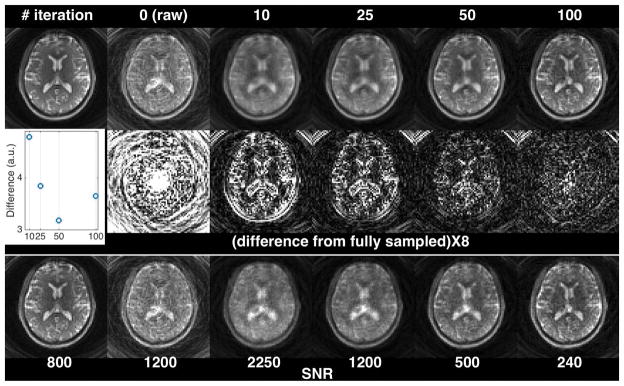
Figure 3.
Evaluation of the residual artifact and SNR of the 3D-SPIRiT-reconstructed volumes at different numbers of iterations. Only a representative axial slice is shown. The image on the upper left is from the fully sampled volume (reference). The undersampled k-space data were derived from the fully sampled volume by undersampling in kz and inverse gridding to the variable-density spiral trajectories using non-uniform FFT. From top to bottom are magnitude images, the absolute difference maps from the reference (multiplied by 8), and the computed empirical SNR maps. The inset in the 2nd row plots the total absolute difference of each SPIRiT volume from the reference volume (i.e., sum of all voxels in each difference volume) as a function of the number of iterations. The numbers in the SNR panel indicate the scales used to plot the corresponding SNR maps at similar brightness. These numbers can be used to approximate the empirical SNR of these images relative to the reference image. For example, at 100 iterations, the image SNR is approximately 30% (240/800) of the SNR of the fully sampled volume.

