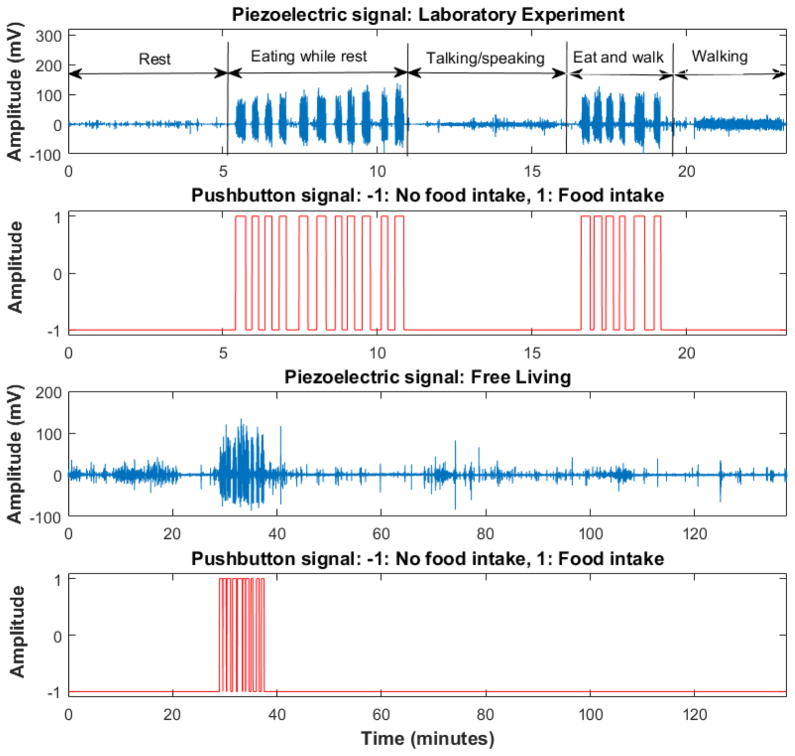
Fig. 2.
Sensor signals captured during laboratory session and during the free-living experiment. (a) The first row shows the activities performed by the participants in the laboratory session and the corresponding piezoelectric sensor signal. The second row shows the pushbutton signal. (b) Third row shows the piezoelectric strain sensor during free living experiment. Last row shows the pushbutton signal during the free-living experiment.

