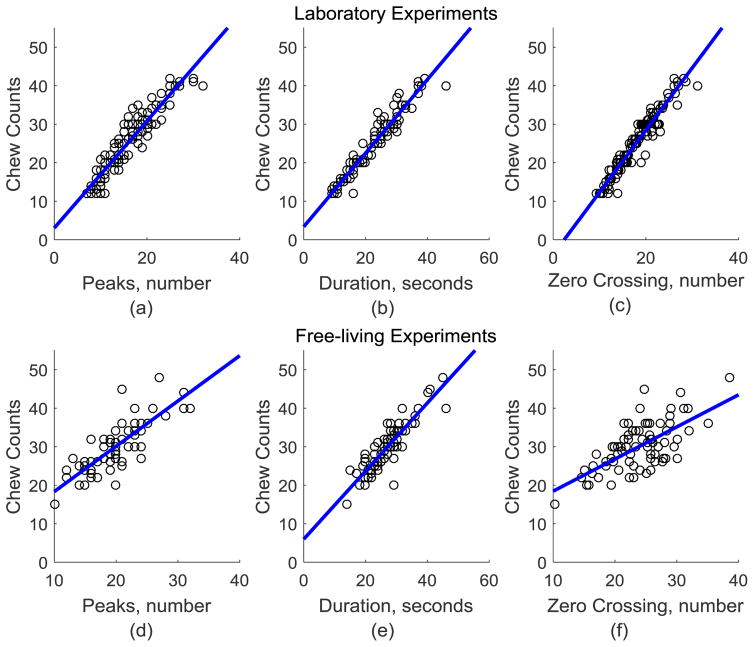
Fig. 5.
Scatter plot of chew counts versus 3 features computed from piezoelectric strain sensor signal. Computed features were number of peak, duration and number of zero crossings (ZC) in a chewing sequence. First row shows the scatter plots for laboratory experiments. Blue line indicated the regression fit when only one variable is used. Each plot shows regression fit where dependent variable is the number of chew counts (a) Regression equation: y = 1.4*(No. of Peaks) + 3.1 (b) Regression equation: y = 0.96*(Duration) + 3.4 (b) Regression equation: y = 1.6*(ZC) + (−3.8). Second row shows linear regression models for data collected during free living. (d) Regression equation: y = 1.2*(No. of Peaks) + 6.6 (e) Regression equation: y = 0.88*(Duration) + 6. (f) Regression equation: y = 0.83*(ZC) + 10. Scatter plot suggests that there is a linear relationship between the number of chews and the three computed features.

