
Figure 1.
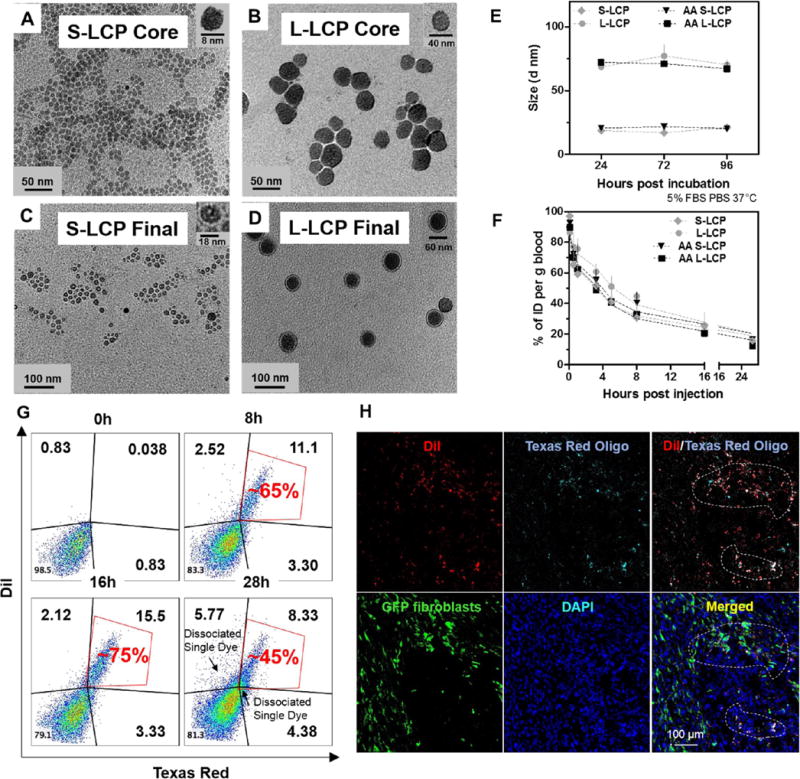
Characterization of LCP NPs. (A,B) Representative TEM images of LCP cores (S/L). (C,D) TEM images of final LCP NPs (S/L). (E) In vitro stability of LCP NPs (S/L, ±AA) in 5% FBS, 37 °C, over 96 h. (F) PK profiles of LCP NPs (S/L, ±AA). (G) Co-association of DiI and Texas Red Oligo in the same cells within the UMUC3/3T3-GFP tumor models 8, 16, and 28 h after double fluorescence-labeled NPs injection. Data were analyzed by flow cytometry, and the fluorescence was compensated. The red-marked population indicates the % of double positive cells in all fluorescence positive cells. (H) Fluorescence images of DiI/Texas Red Oligo-labeled LCP NPs in the GFP positive fibroblasts 8 h post-injection of the UMUC3/3T3-GFP tumors. The circled (white dot) population indicates the double fluorescences (DiI and Texas Red) in GFP-fibroblasts (upper circles) or nonfibroblast cells (lower circles) (cryosection).