
Figure 4.
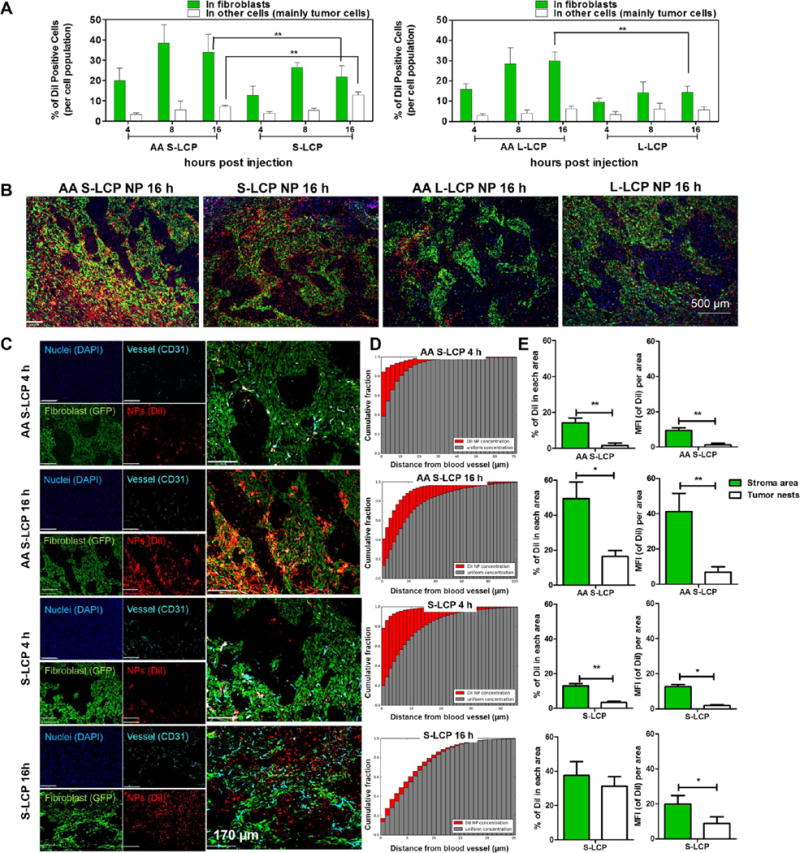
Time-dependent association of nontargeted and targeted NPs in fibroblasts and other cells (mainly tumor cells). (A) Flow cytometry analysis of the time-dependent cellular distribution of NPs (S/L, ±AA) (n = 6, **, P < 0.01). (B) Representative low-magnification fluorescent images of DiI NPs distribution in tumor sections 16 h post-injection. Green: 3T3-GFP, red: DiI NPs. (C) Higher-magnification fluorescence images of S-LCP NP (with or without AA) at 4 or 16 h post-injection. Cyan: blood vessel. The accumulative distance of DiI NPs to the nearest CD31 positive blood vessels were quantified (D). In order to quantitatively compare results from different samples, we compute the distance histogram for a uniform concentration of hypothetical particles (gray). Quantification (by ImageJ) of the mean fluorescence intensity (MFI) of DiI (left) or % of DiI positive (right) in the GFP-stroma area and tumor nests area are quantified in (E) (n = 4; * P < 0.05; ** P < 0.01).