
Figure 5.
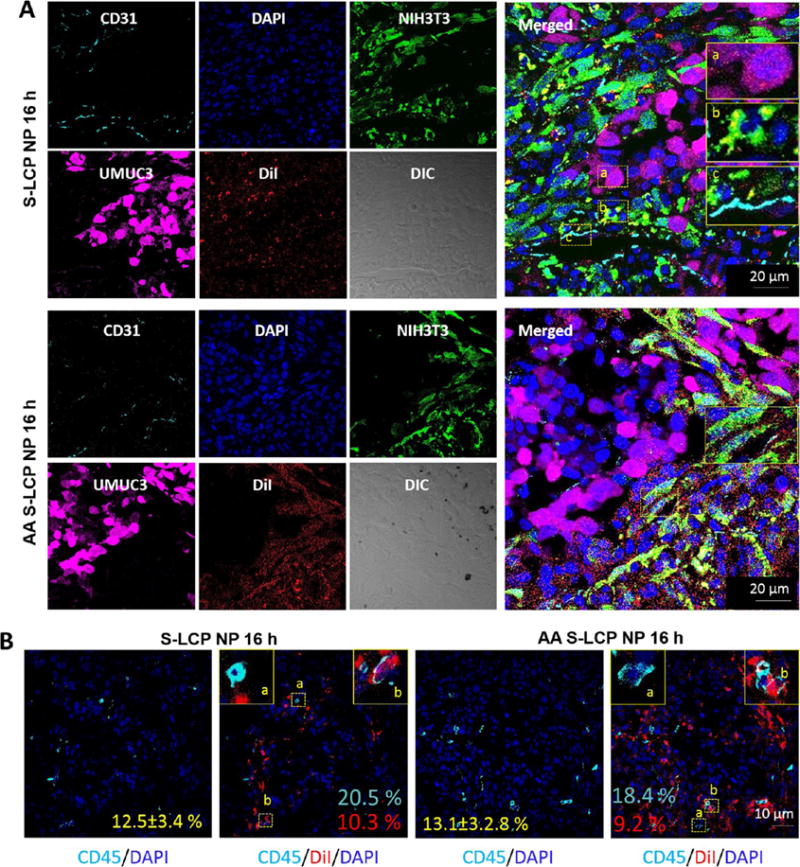
Confocal analysis of the cellular association of S-LCP NPs (with or without AA, DiI labeled) 16 h after i.v. administration in UMUC3/3T3 xenografts. (A) Distribution of S-LCP NPs (with or without AA) in UMUC3- GFP tumor cells (magenta), 3T3-RFP fibroblasts (green), and CD31 endothelial cells (cyan). Single color panels on the left. Merged images are shown on the right. Particular areas are magnified for clear visualization (yellow dotted rectangle). Red arrows indicate the representative association of NPs with fibroblasts, white arrows indicate the representative association of NPs with tumor cells, and cyan arrows indicate endothelial outline. Nontargeted NPs showed scattered distributions in both fibroblasts and tumor cells. Fewer NPs are associated with the endothelial outline. (B) Distribution of NPs in CD45 positive leukocytes (cyan). Yellow numbers indicate the % of CD45 positive cells among all cell populations (mean ± SD). Cyan numbers quantify the % of CD45 positive cells that have taken up NPs (mean ± SD). Red numbers quantify the % of DiI (NPs) positive cells that are leucocytes (mean ± SD). Both nontargeted and targeted NPs can be internalized by the leucocytes.