
Figure 7.
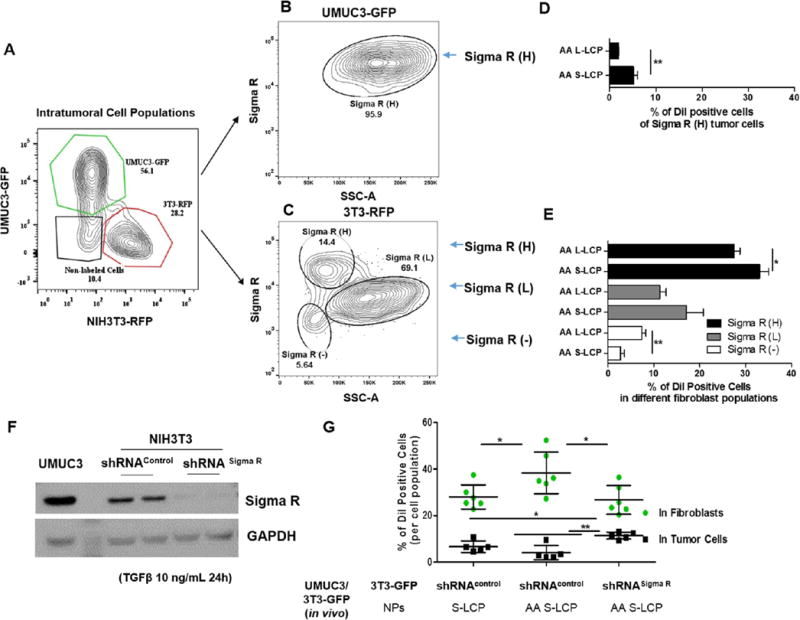
Correlation between Sigma R level and distribution of targeted NPs. (A) Gating of UMUC3-GFP and 3T3-RFP in dissociated tumor tissues. (B,C) Gating of Sigma R positive populations in tumor cells and fibroblasts. Isotype controls are shown in Supporting Information figures. Most tumor cells have high and coherent Sigma R expressions, whereas, fibroblasts can be classified into Sigma R (H), Sigma R (L), and Sigma R (−) groups based on the expression of Sigma R levels. (D,E) Quantitative flow analysis of the distribution of DiI AA-NPs in different groups (different Sigma R level) of cells. (F) Western blot confirmation of the shRNA knockout of Sigma R in the NIH3T3 fibroblasts in vitro. (G) % of DiI positive cells in tumor cells and fibroblasts 8 h after injection of DiI NPs in the normal UMUC3/3T3-GFP model or UMUC3/3T3-GFP Sigma R knockout model (n = 6). * P < 0.05; ** P < 0.001.