
Figure 8.
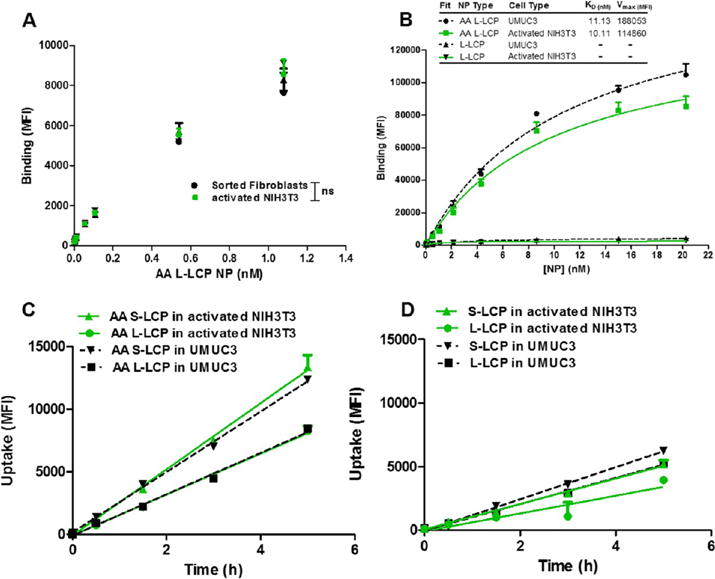
Binding affinity and uptake rate of LCP NPs (S/L, ±AA) in UMUC3 and activated fibroblasts. (A) Binding curve of AA L-LCP NPs for activated NIH3T3 and sorted GFP-fibroblasts from the stroma-rich bladder tumor models. (B) Binding affinity of LCP NPs (S/L, ±AA) in UMUC3 and activated NIH3T3. The data points were fitted to Michaels–Menten curve, KD, and Vmax were calculated and shown in the chart. Time-dependent uptake of 1 nM LCP NPs (S/L) with or without AA in activated NIH3T3 and UMUC3 is shown in (C) and (D), respectively (n = 3).