
Figure 9.
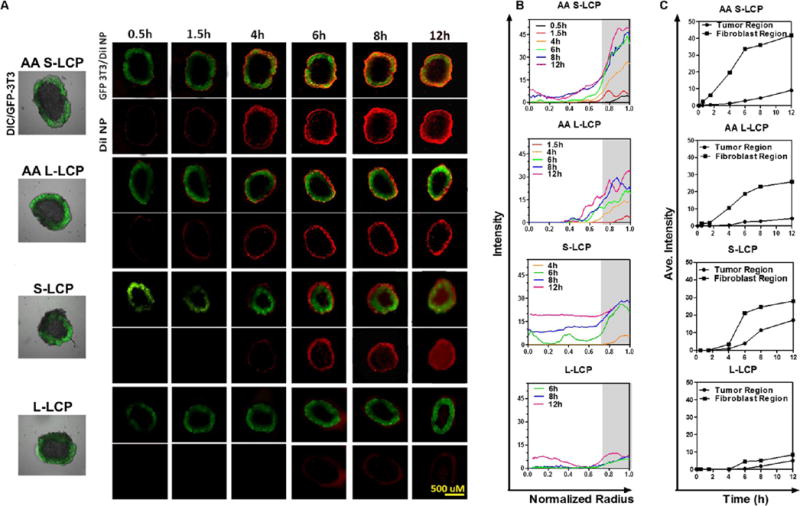
Penetration, binding, and internalization kinetics of LCP NP (L/S, ±AA) in a core–shell ex vivo spheroid model. The core–shell 3D spheroid model was established by coating the UMUC3 spheroid with 3T3-GFP fibroblasts. Fluorescence images were acquired after incubation with DiI-labeled LCP NPs for determined time points and shown in (A). Scale bar, 500 μm. The corresponding fluorescence intensity profiles are shown at determined time points in (B). The gray zone indicates the position of fibroblasts. Change of average fluorescence intensities over time in the tumor region and the fibroblast region after incubation with DiI-labeled LCP NP are shown in (C). Mean value was presented (n = 3).