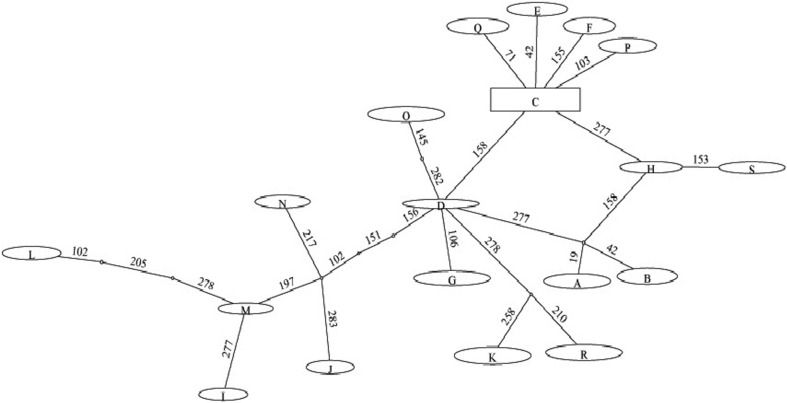
Fig. 3.
TCS network of the haplotypes of Achatina fulica. Network tree depicted was obtained by selecting the ‘spring tree’ option in the TCS software. Indicated on the lines connecting different haplotypes is the position of the nucleotide sequence variation. The size of the oval or square box do not exactly correspond to the haplotype frequency. The frequency of each haplotype was rounded off to one, except for the isolates sequenced in the present study

