
Figure 1.
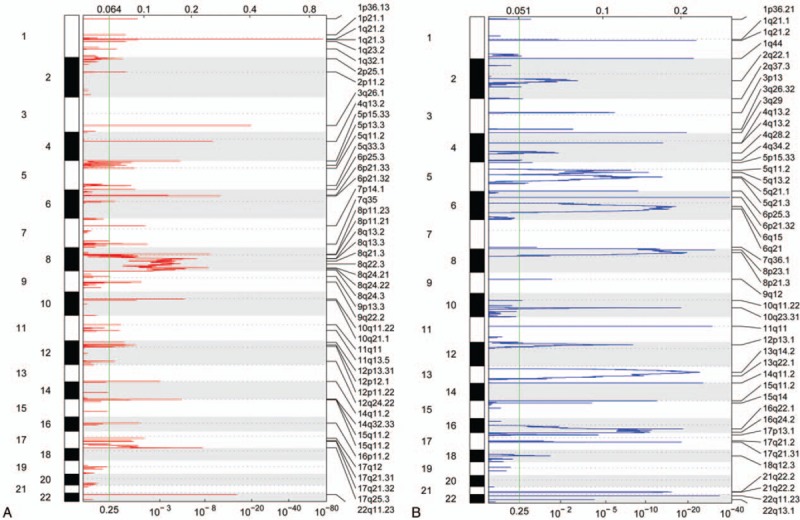
Amplified and deleted regions of copy-number variations (CNVs) on chromosomes. (A) Amplified regions of CNVs. (B) Deleted regions of CNVs. The numbers on the left vertical axis represent chromosomes, and the labels on the right represent varied regions of CNVs. The values on the top horizontal axis represent G-scores, and values on the horizontal axis at the bottom represent q values. The larger G-score and smaller q value indicate that the CNVs were more significant.