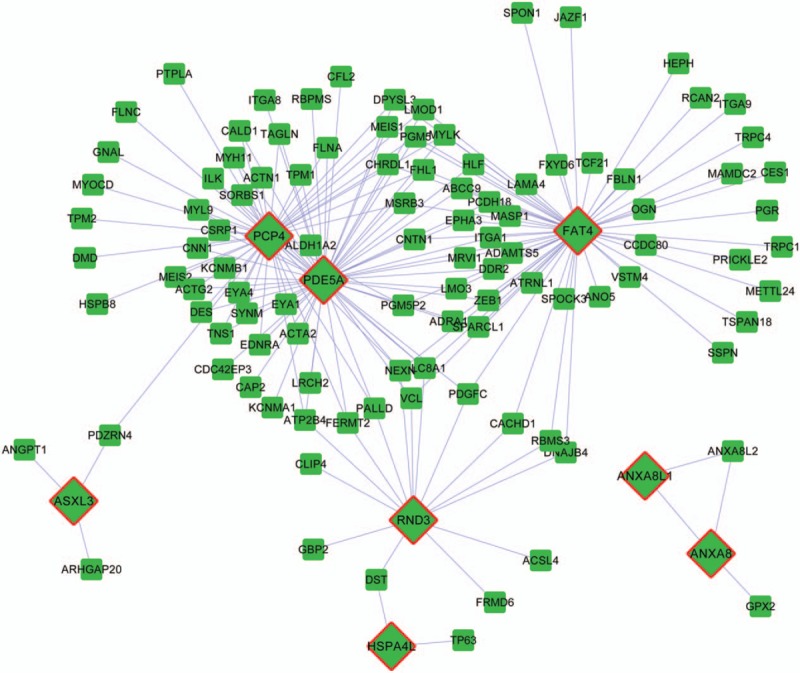
Figure 2.

Coexpression network of differentially expressed genes (DEGs) with copy-number variations (CNVs) and DEGs without CNVs. Squares represent DEGs without copy-number variations. Rhombuses represent DEGs with copy-number variations. Lines represent the coexpression correlations between genes.
