
Figure 1.
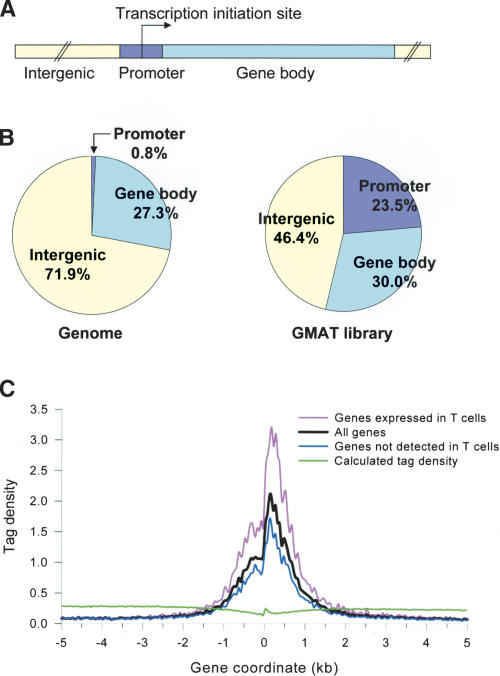
High levels of the H3 acetylation are detected in the promoter regions. (A) A schematic showing the human genome arbitrarily separated into three parts: 2-kb promoter regions, intergenic regions, and gene body regions. (B, left) Calculated percentage of each region in the genome. (Right) The percentage of the tags detected in the GMAT library from each region. (C) A 10-kb region of 21,355 genes was aligned relative to their transcription initiation sites (X-axis). The Y-axis shows the tag density that was obtained by normalizing the total number of detected tags with the number of expected NlaIII sites in a 50-bp window. The green line represents the calculated value, provided the tags were detected randomly. The black line represents the tag density of all of the 21,355 genes. The pink line represents the tag density of the 8000 highly active genes. The blue line represents the rest of the genes that are either silent or expressed at lower levels.