
Figure 3.
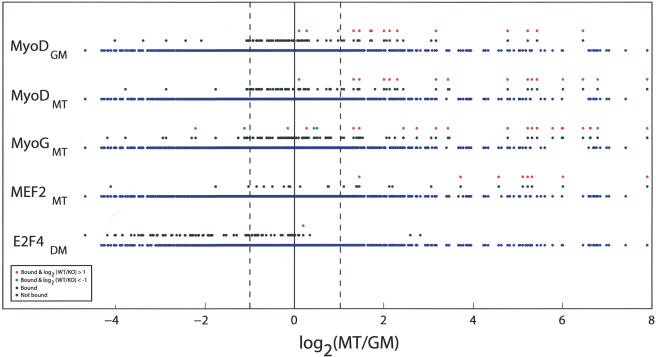
Linking binding of MRFs and MEF2 with gene expression during myogenesis. We plotted the distribution of gene expression values [log2(MT/GM)] along the horizontal axis for all genes present in our factor binding and expression data sets. (MT and GM) Normalized Affymetrix expression values for myotubes and growing cells, respectively. Blue and black dots represent genes that are not bound or bound by the indicated factors, respectively. Expression profiling results comparing genes bound by the indicated factor in primary wild-type and MyoD-/- mouse myoblasts are indicated with red and green dots that represent genes whose expression is up-regulated or down-regulated by greater than twofold, respectively, in wild-type compared with KO. Dotted lines indicate the zone within which no significant change in expression occurred. All genes are displayed in identical positions along the X-axis to compare binding of factors and conditions.