
Figure 4.
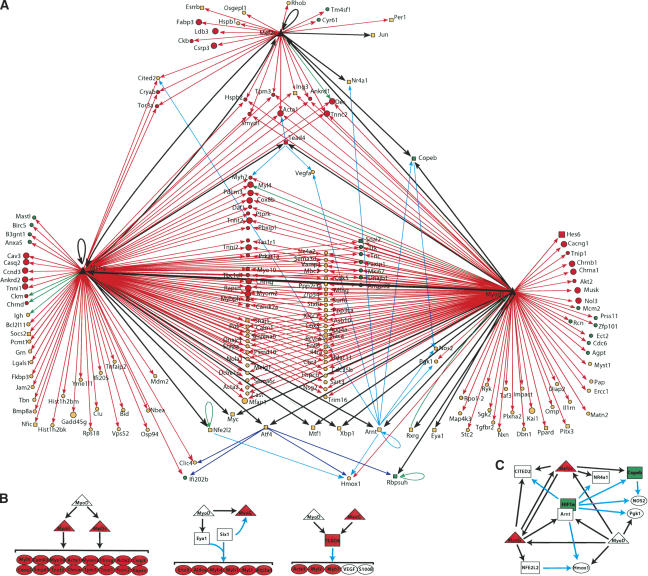
A transcriptional regulatory network in muscle cells MRFs and MEF2 (large black triangles) are connected by arrows to their target genes. The expression patterns of each target are color-coded to reflect changes in expression patterns during differentiation: red or green if their expression level is at least twofold higher or lower, respectively, in myotubes than in the GM state. Orange nodes represent genes with intermediate expression ratios. Transcription factors (TFs) are represented by squares and are connected with black arrows. Other genes (non-TFs) are represented as circles and are connected by red arrows. Literature mining was used to add additional layers of control as follows: Genes shown previously to be regulated by at least two TFs that are bound by MRFs in our experiments or shown to be regulated by at least one MRF, are represented as circles and are connected by green (binding relationship indicated in TRANSFAC), cyan (literature mining), and blue (genes deregulated in tunicamycin-treated Atf4-/- fibroblasts) (Harding et al. 2003) arrows. (B) MRFs regulate the expression of transcriptional regulators that induce the expression of muscle function genes. (C) Feed-forward loops and complex network motifs are illustrated.